Environmental E-Democracy
Introduction
As an older coastal city, New York faces imminent threats from climate change including flooding from sea level rise and storms, increasing heat vulnerability, and deteriorating air quality. Simultaneously, many citizens of New York experience threats unequally - often those at highest risk are low income, immigrant populations with fewer resources to advocate for needed policy and infrastructure interventions. NYC311 is the City’s platform allowing the government to respond to requests for non-emergency services, which provides New Yorkers an avenue to request action ranging from pest control to maintenance of city infrastructure.
As climate change continues to accelerate, it is likely that the scope of complaints 311 oversees will increasingly expand to include those relating to environmental risks. Concurrently, there is an increasing interest in e-governance and civic engagement platforms to promote equitable inclusive policy making. This research will investigate the usage of 311 as a civic engagement platform to advocate for policy and infrastructure changes in light of climate change. Specifically, this study will investigate how equitably New York’s 311 services has served its citizens by determining how reporting rates in neighborhoods with higher environmental risks differ from those in lower risk neighborhoods. Using big data and machine learning techniques, this research will investigate 311 complaints, flood maps, air quality information, and building information to inform policy recommendations. The goal is to promote a more equitable implementation of citizen engagement in light of climate change.
Skills Used:R (dplyr, tidyr, sf, RSocrata, soql, tidycensus, tmap), Research
Exploratory Data Analysis
The first step was to investigate which 311 complaints were most important by agency. This was done by pulling 311 complaints through the NYC Open Data API, then analyzing all complaint types by agency, over the years, analyzing their text descriptions, and describing their geographic distribution. You can see a deeper dive of that analysis
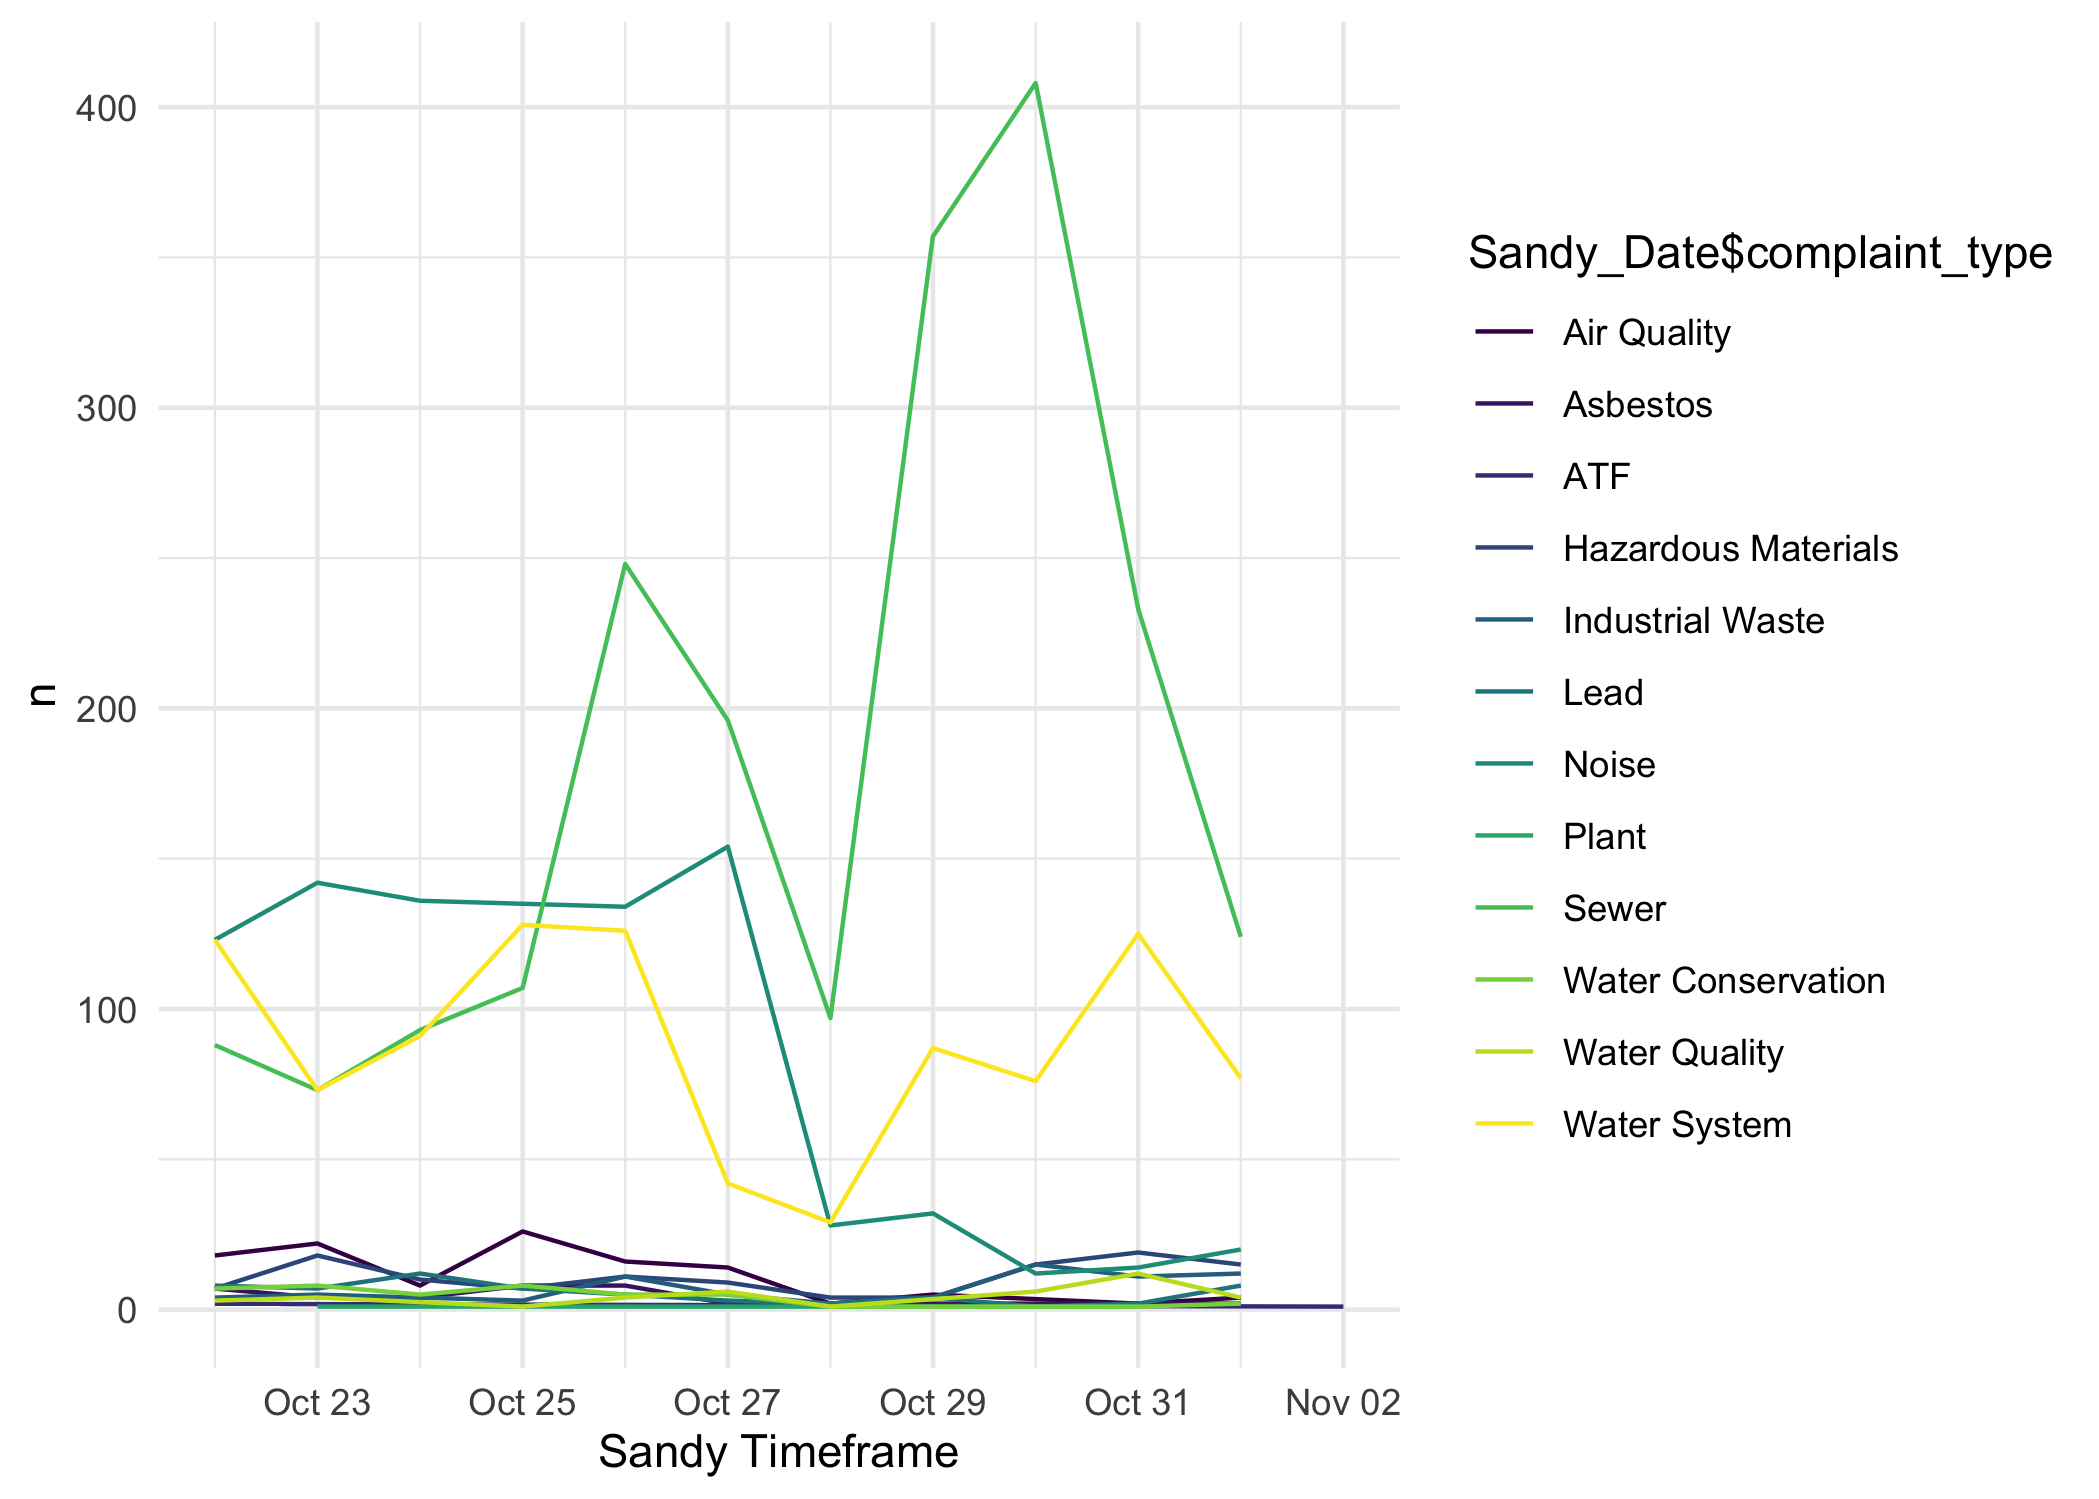
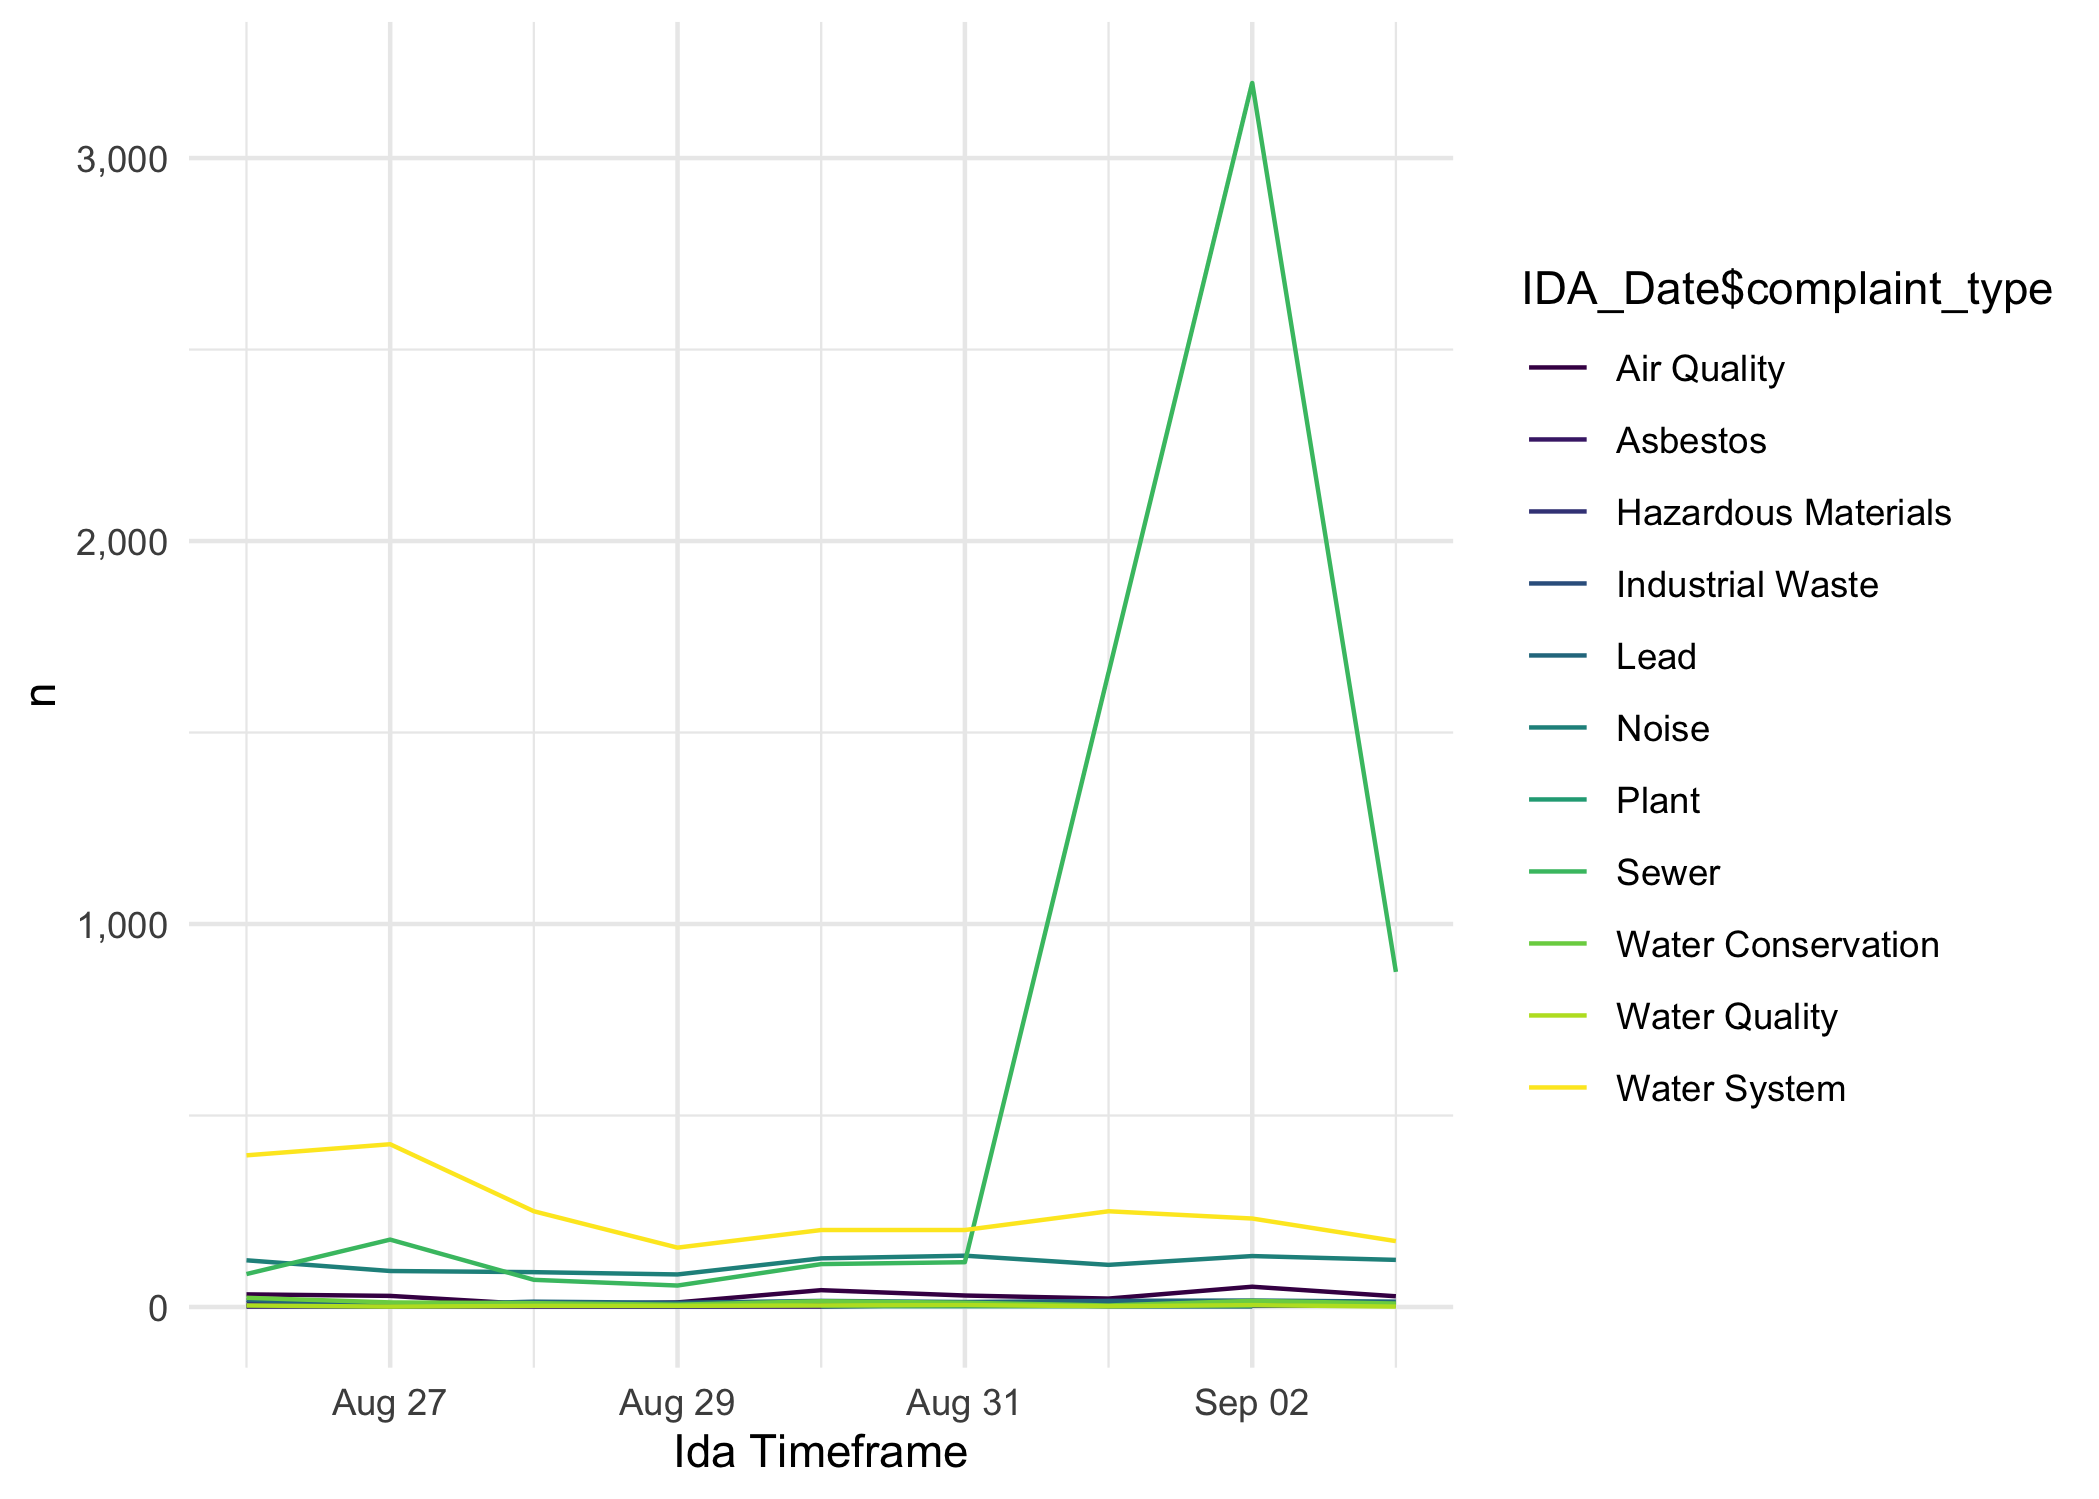
With the information gathered, the next step was to investigate how complaints changed after a stress test. We investigated events occuring during Sandy and Ida.
Sandy Complaints
Ida Complaints
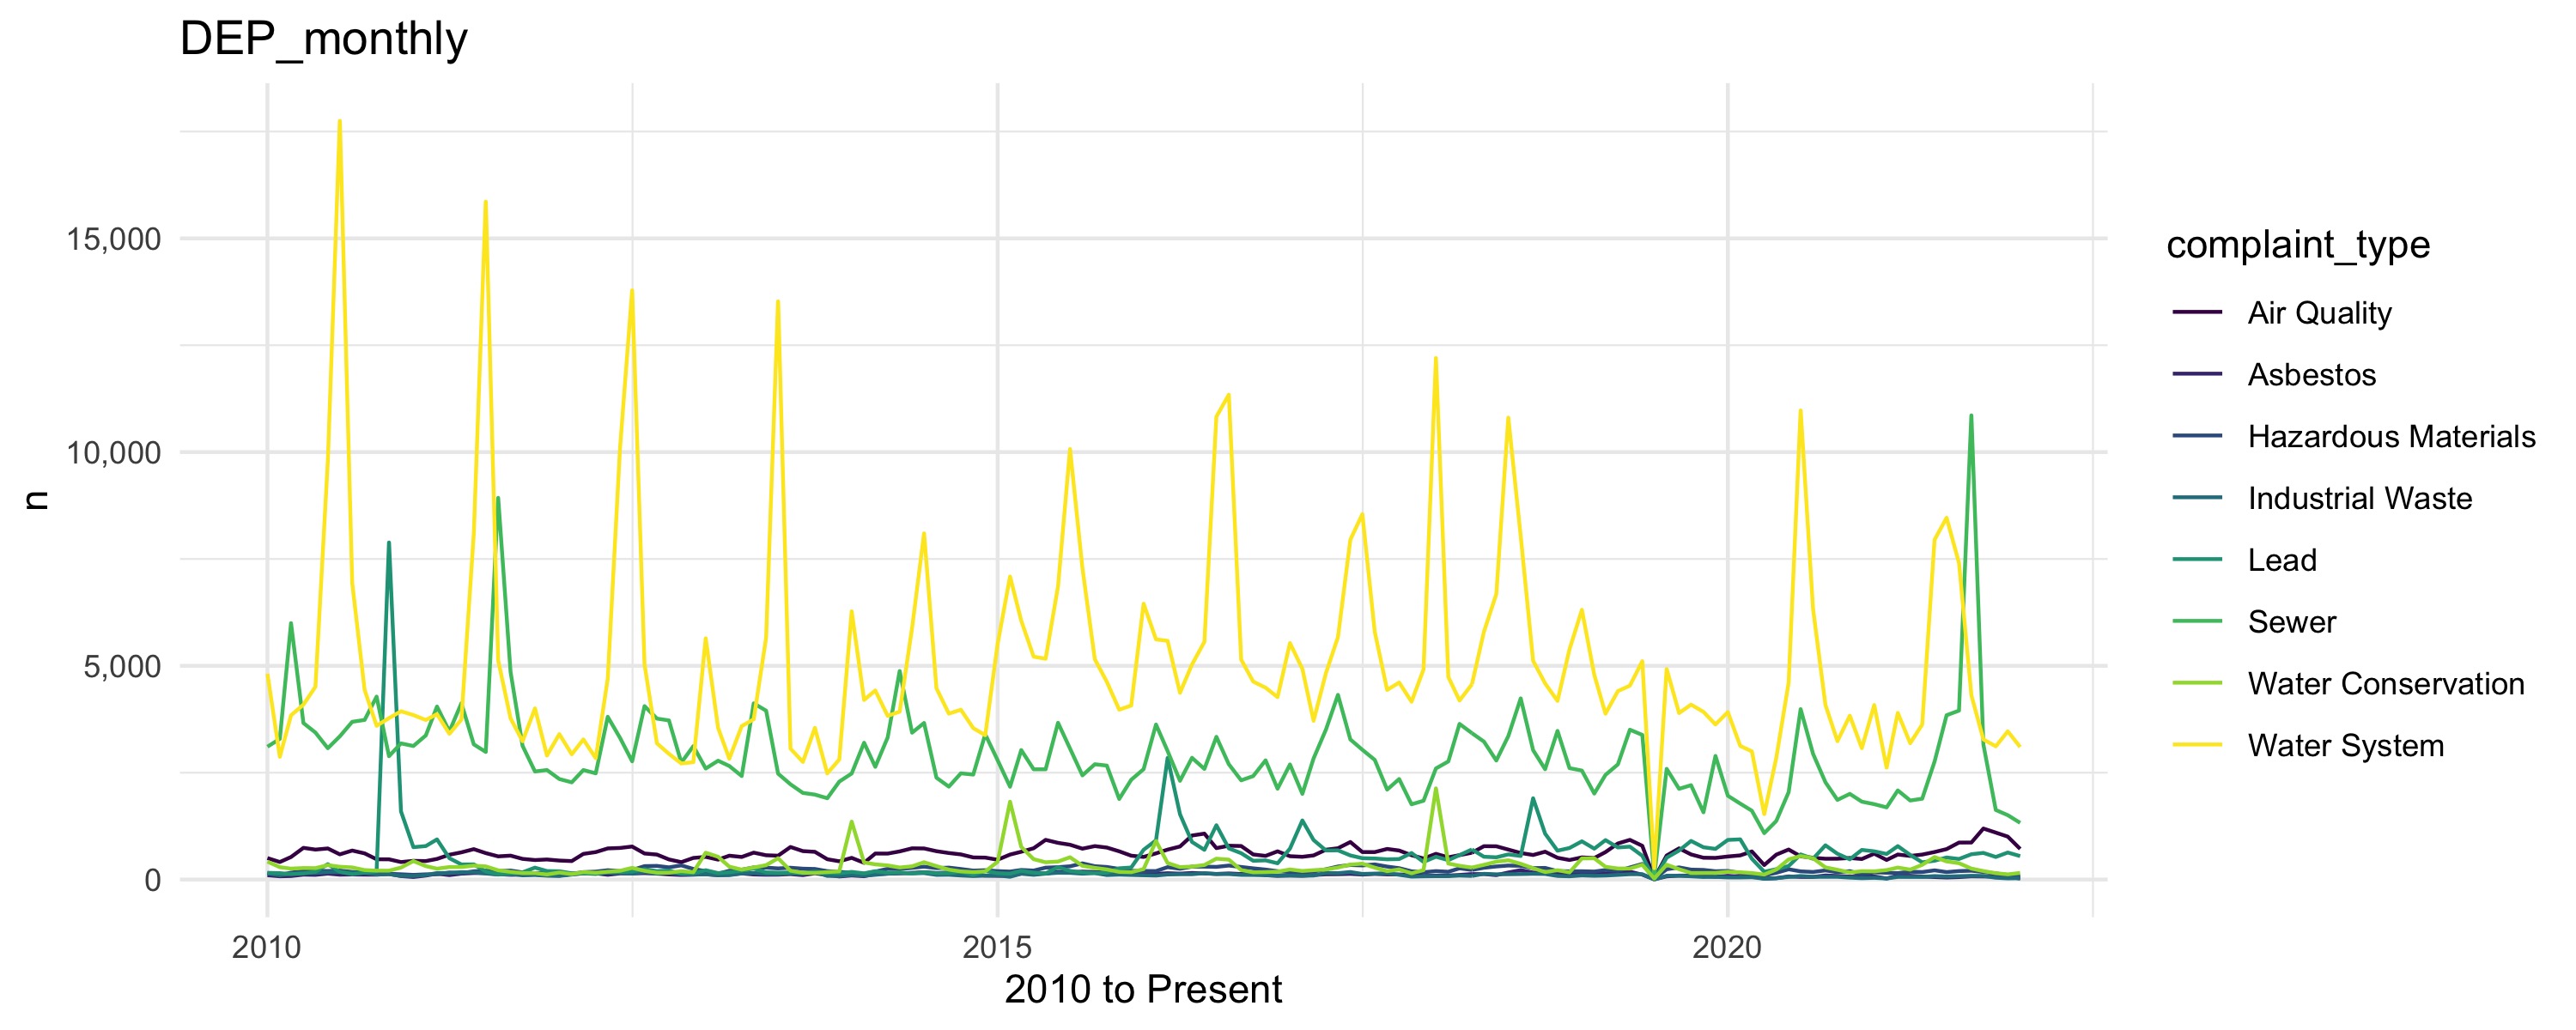
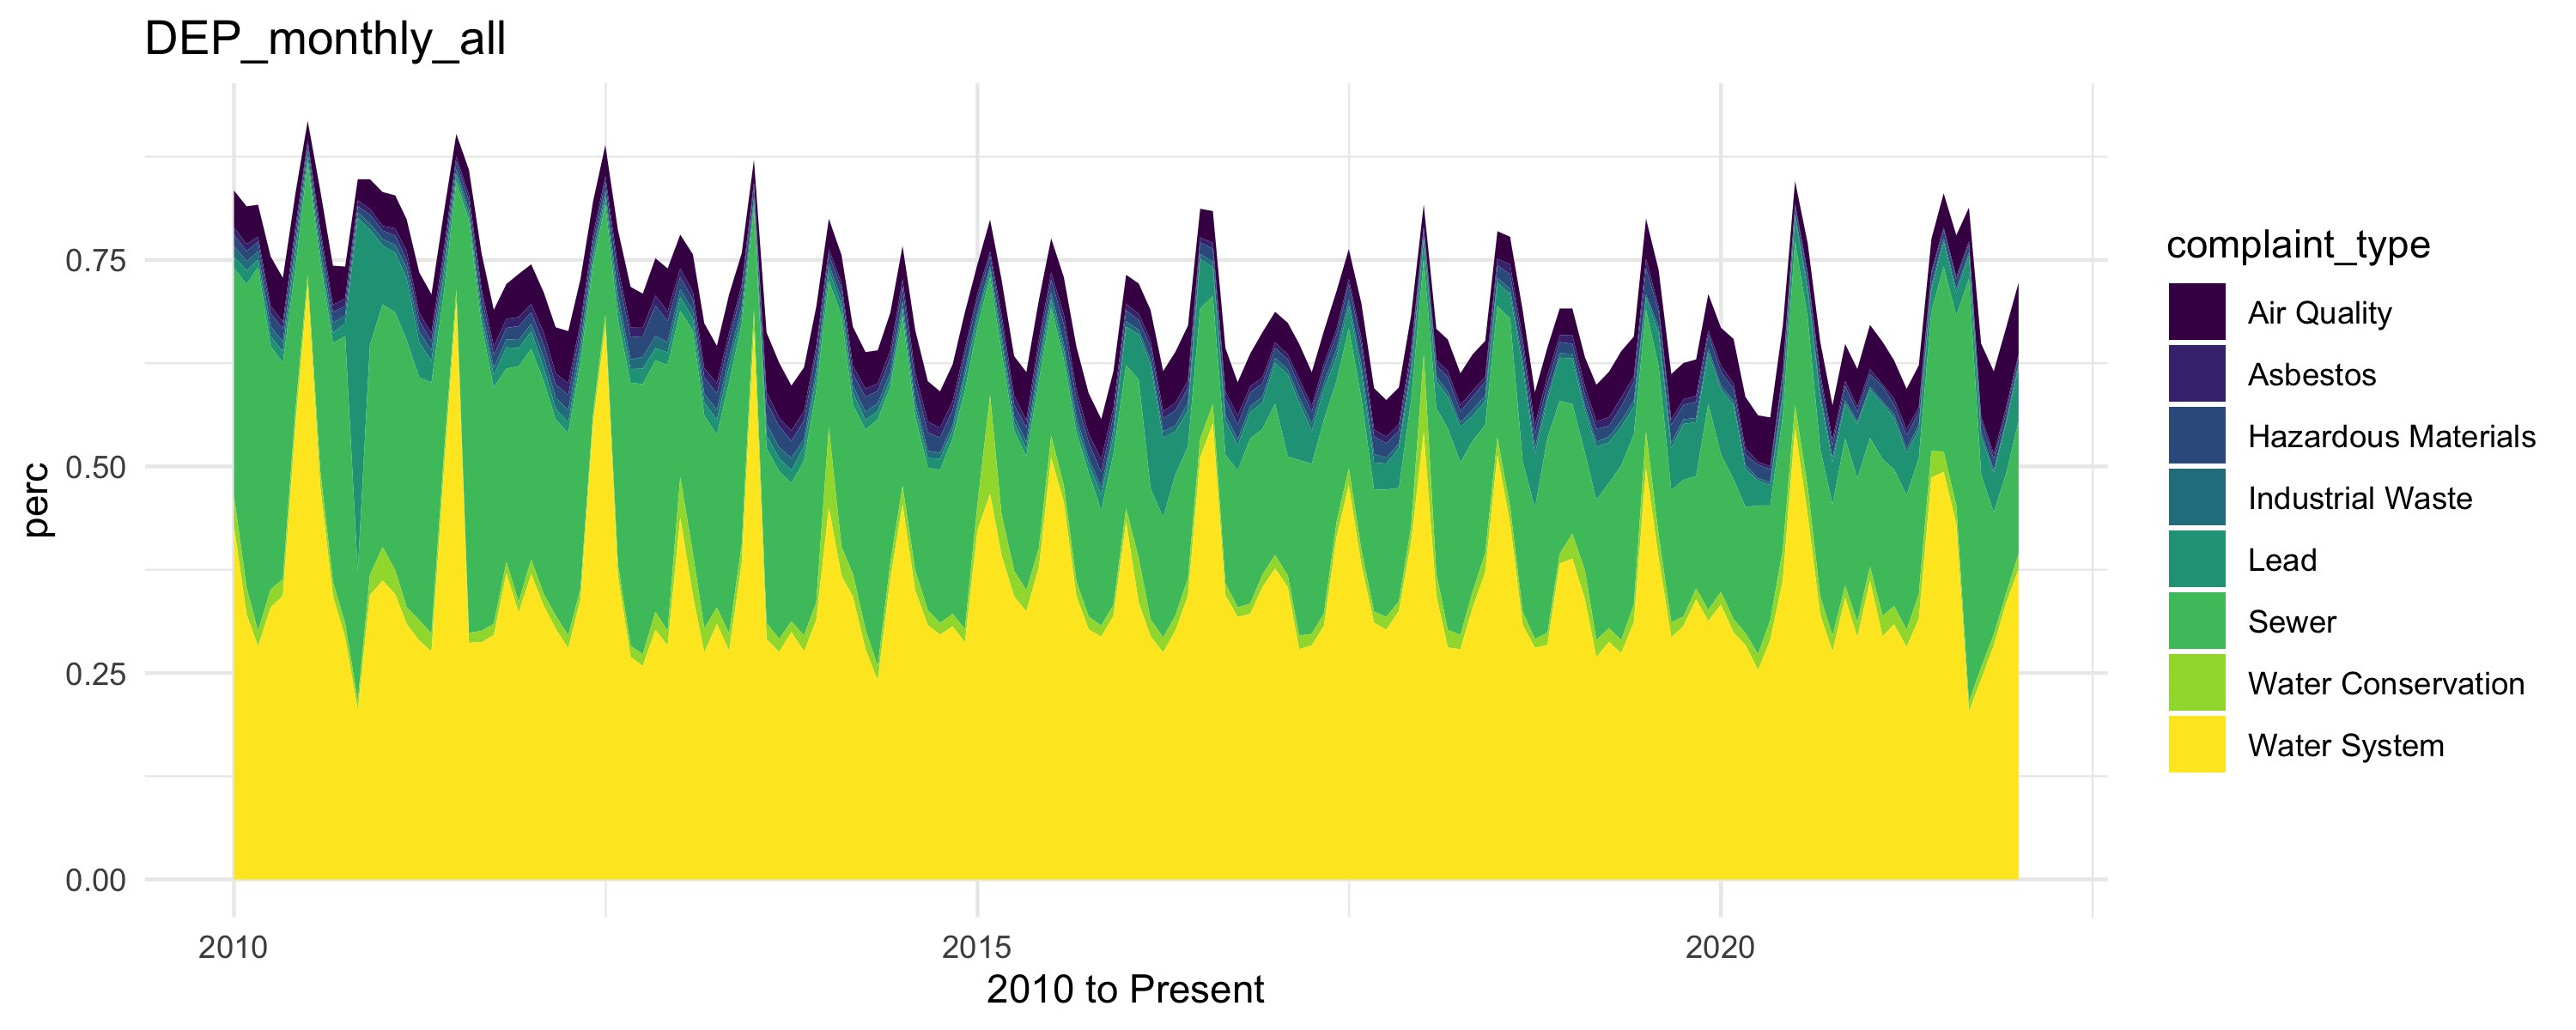
Time Series Analysis of DEP 311 Complaints:
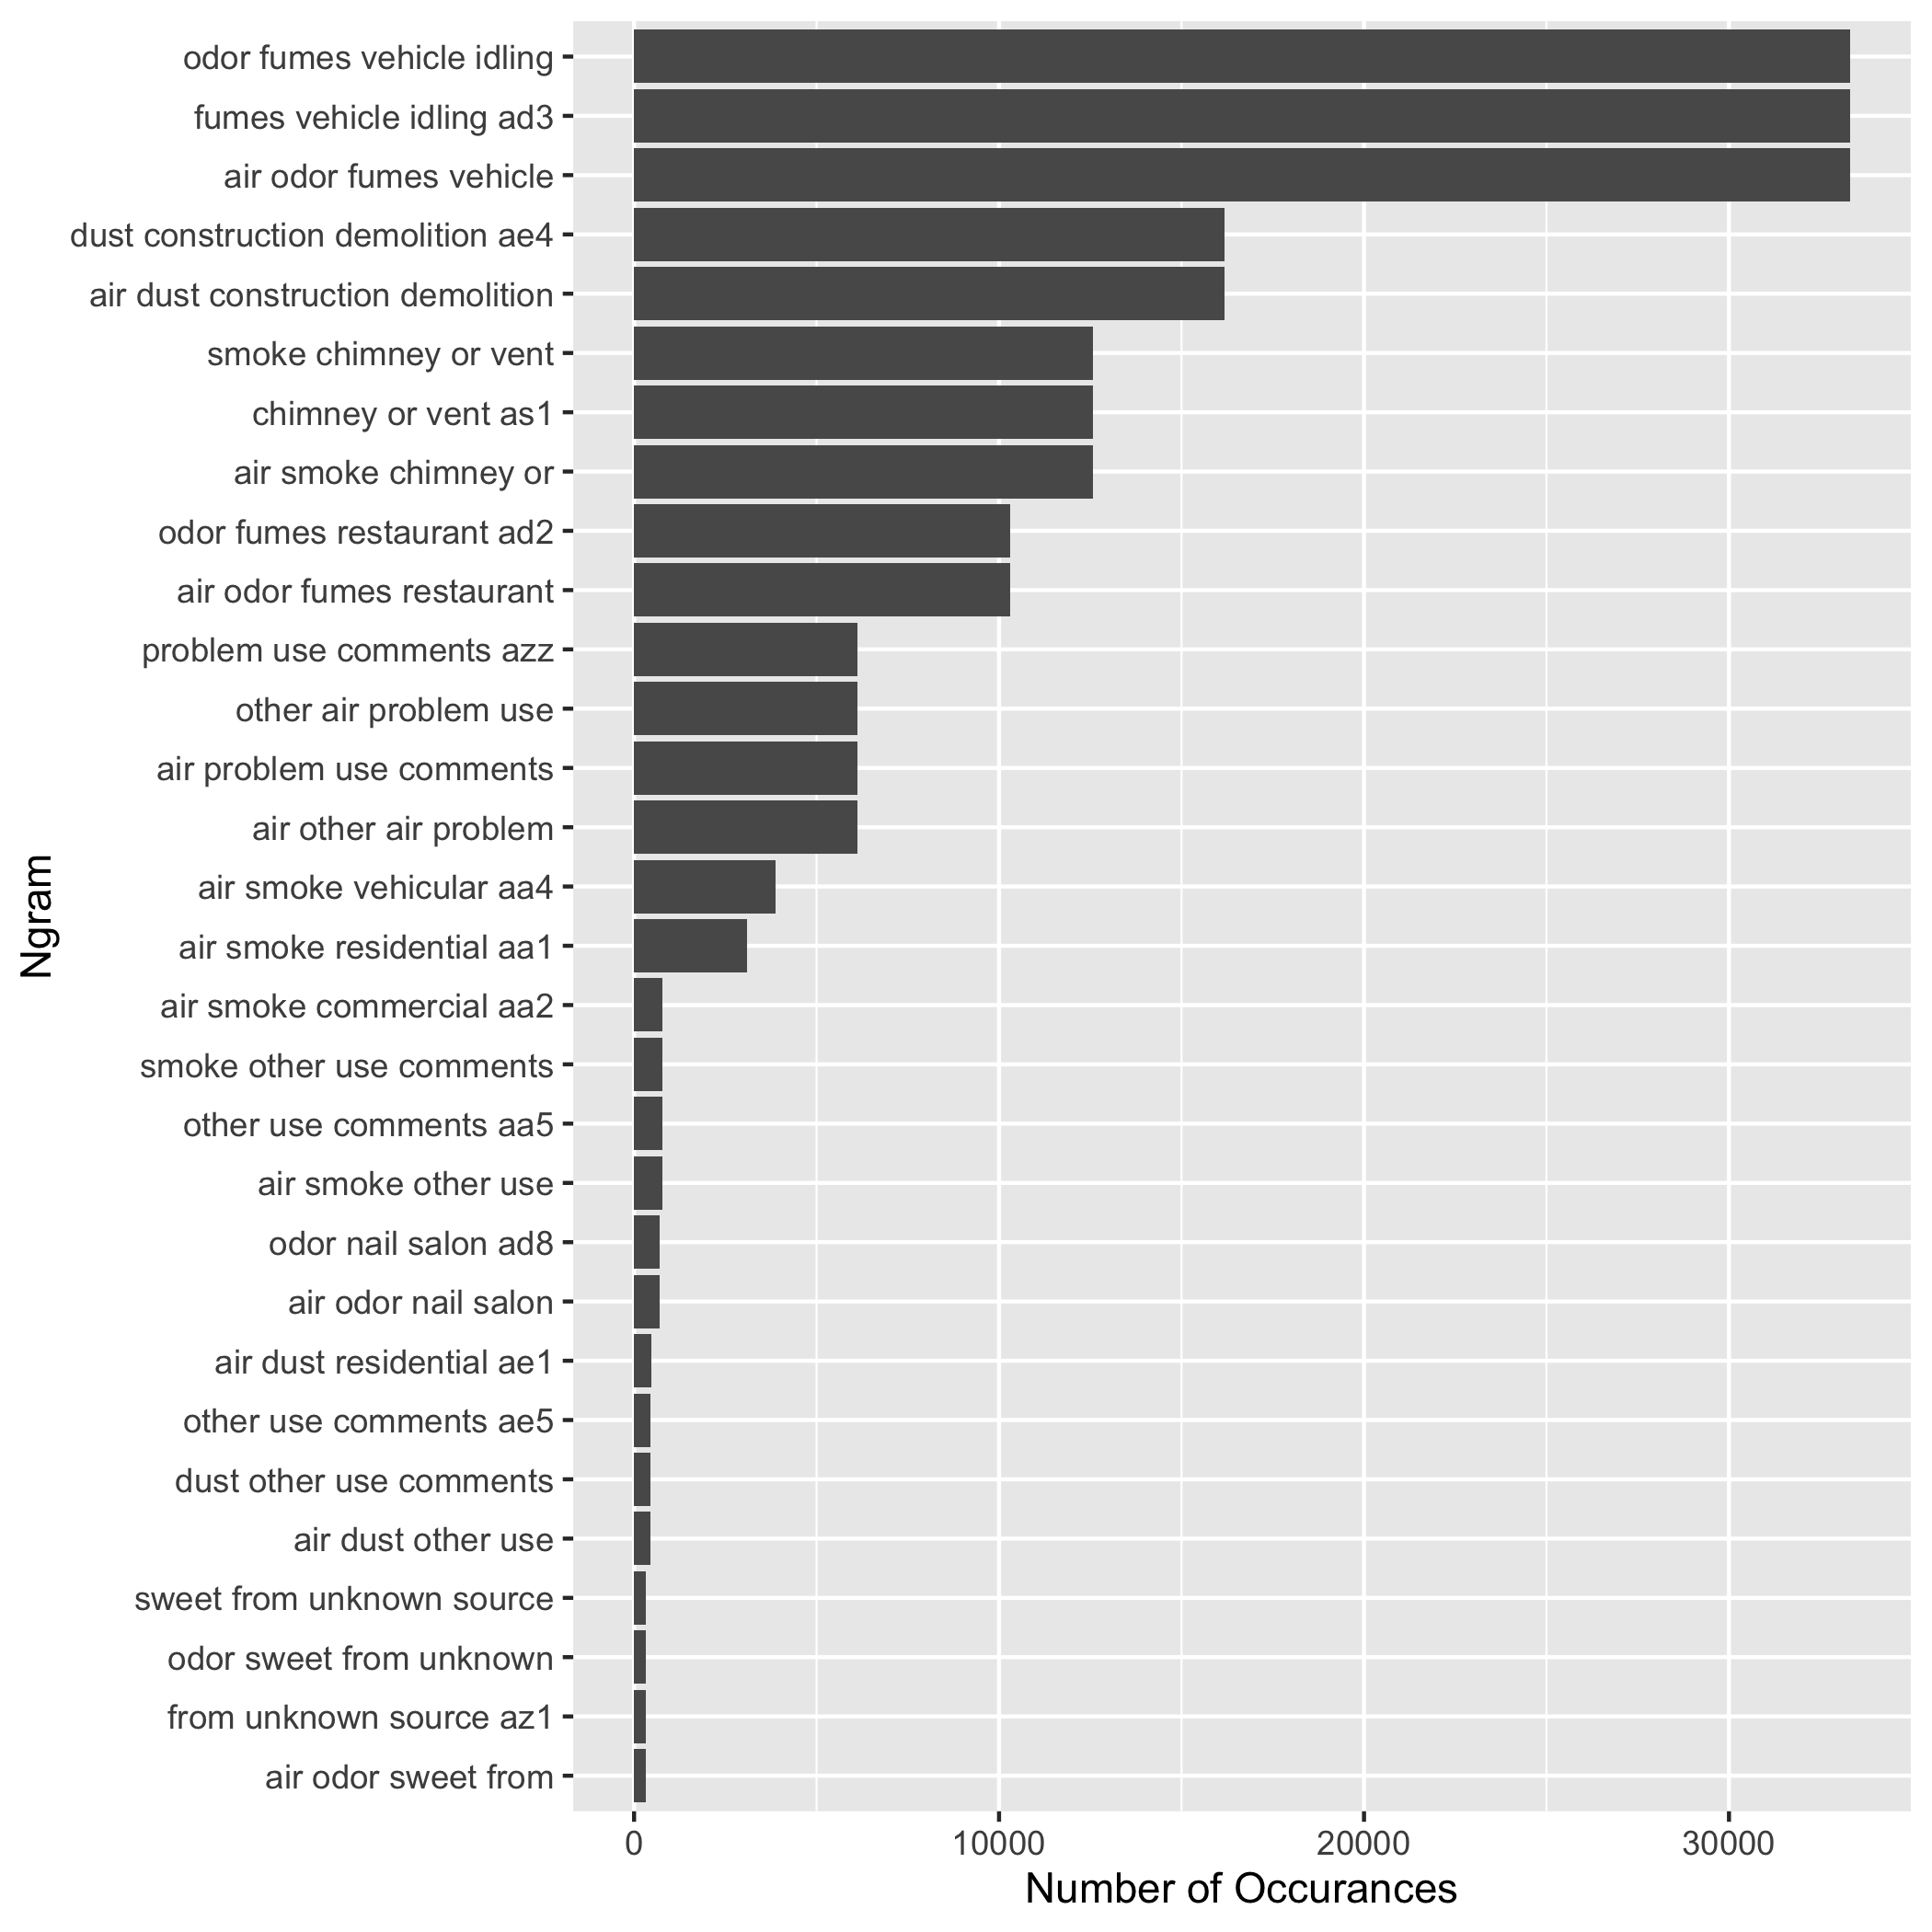
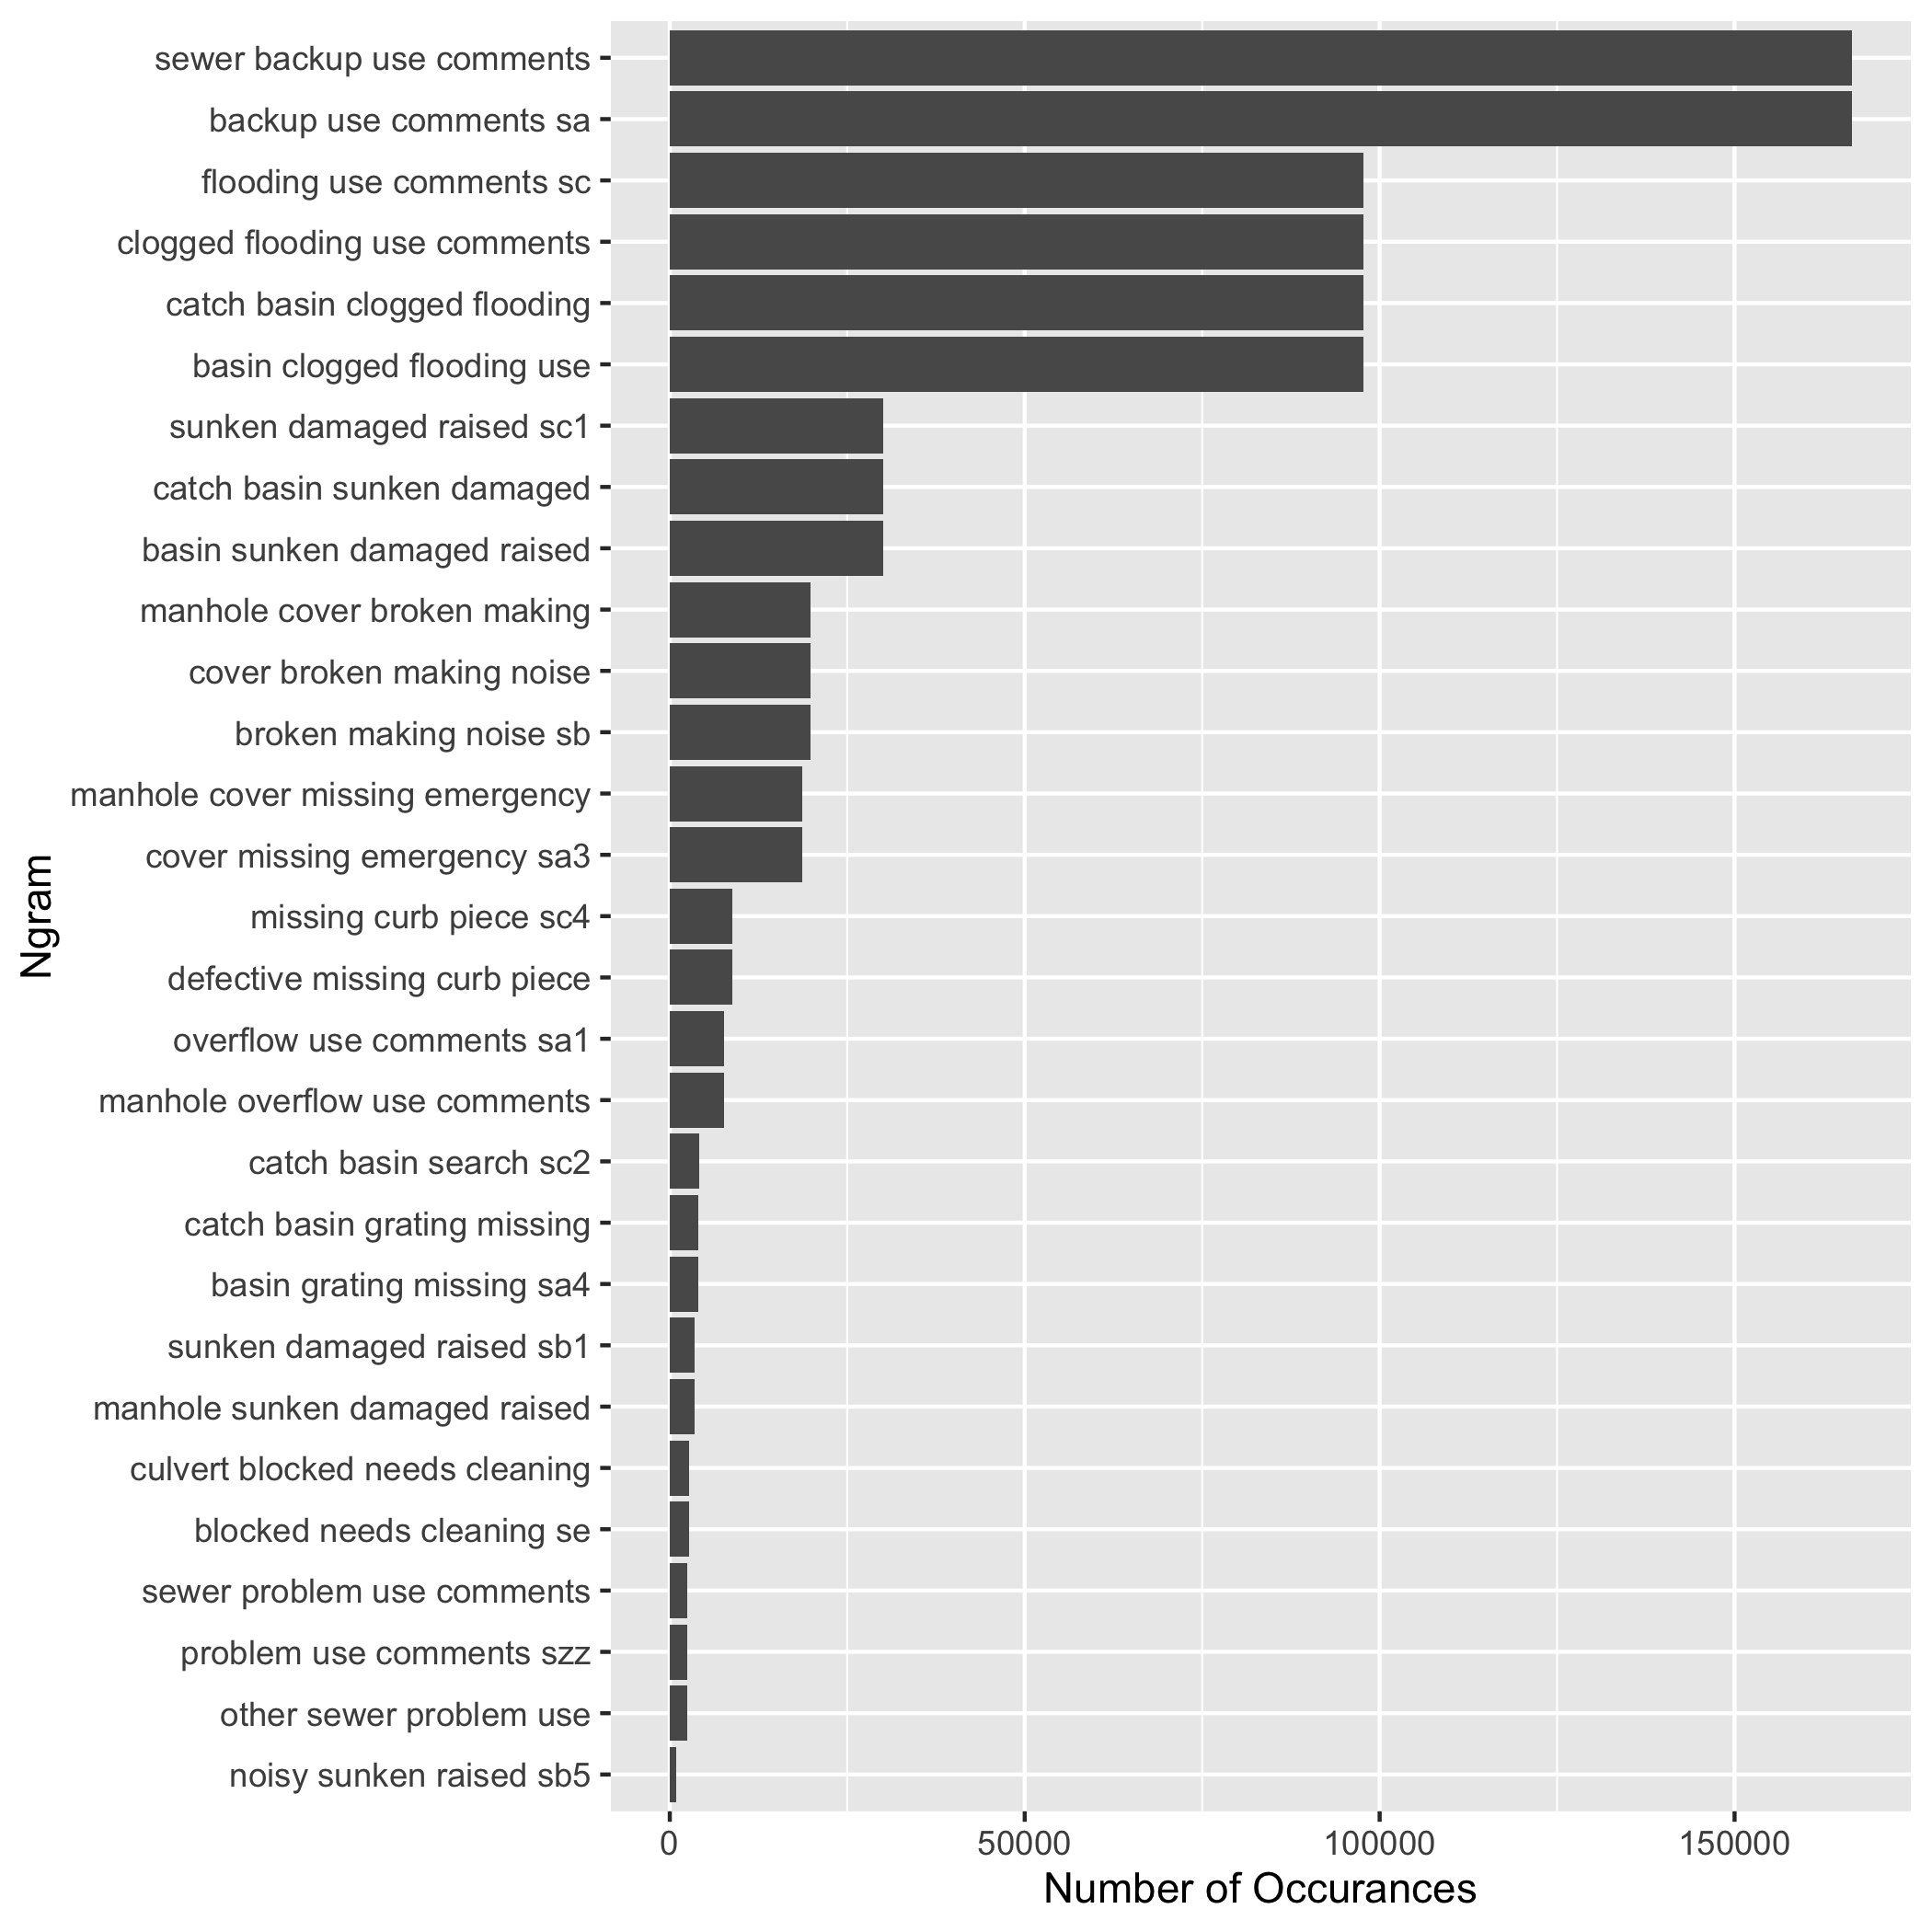
Ngram Analysis
Text analysis was used to determine what are typical words used depending on the type of complaint. For air quality and sewer complaints became the best candidates for further analysis:
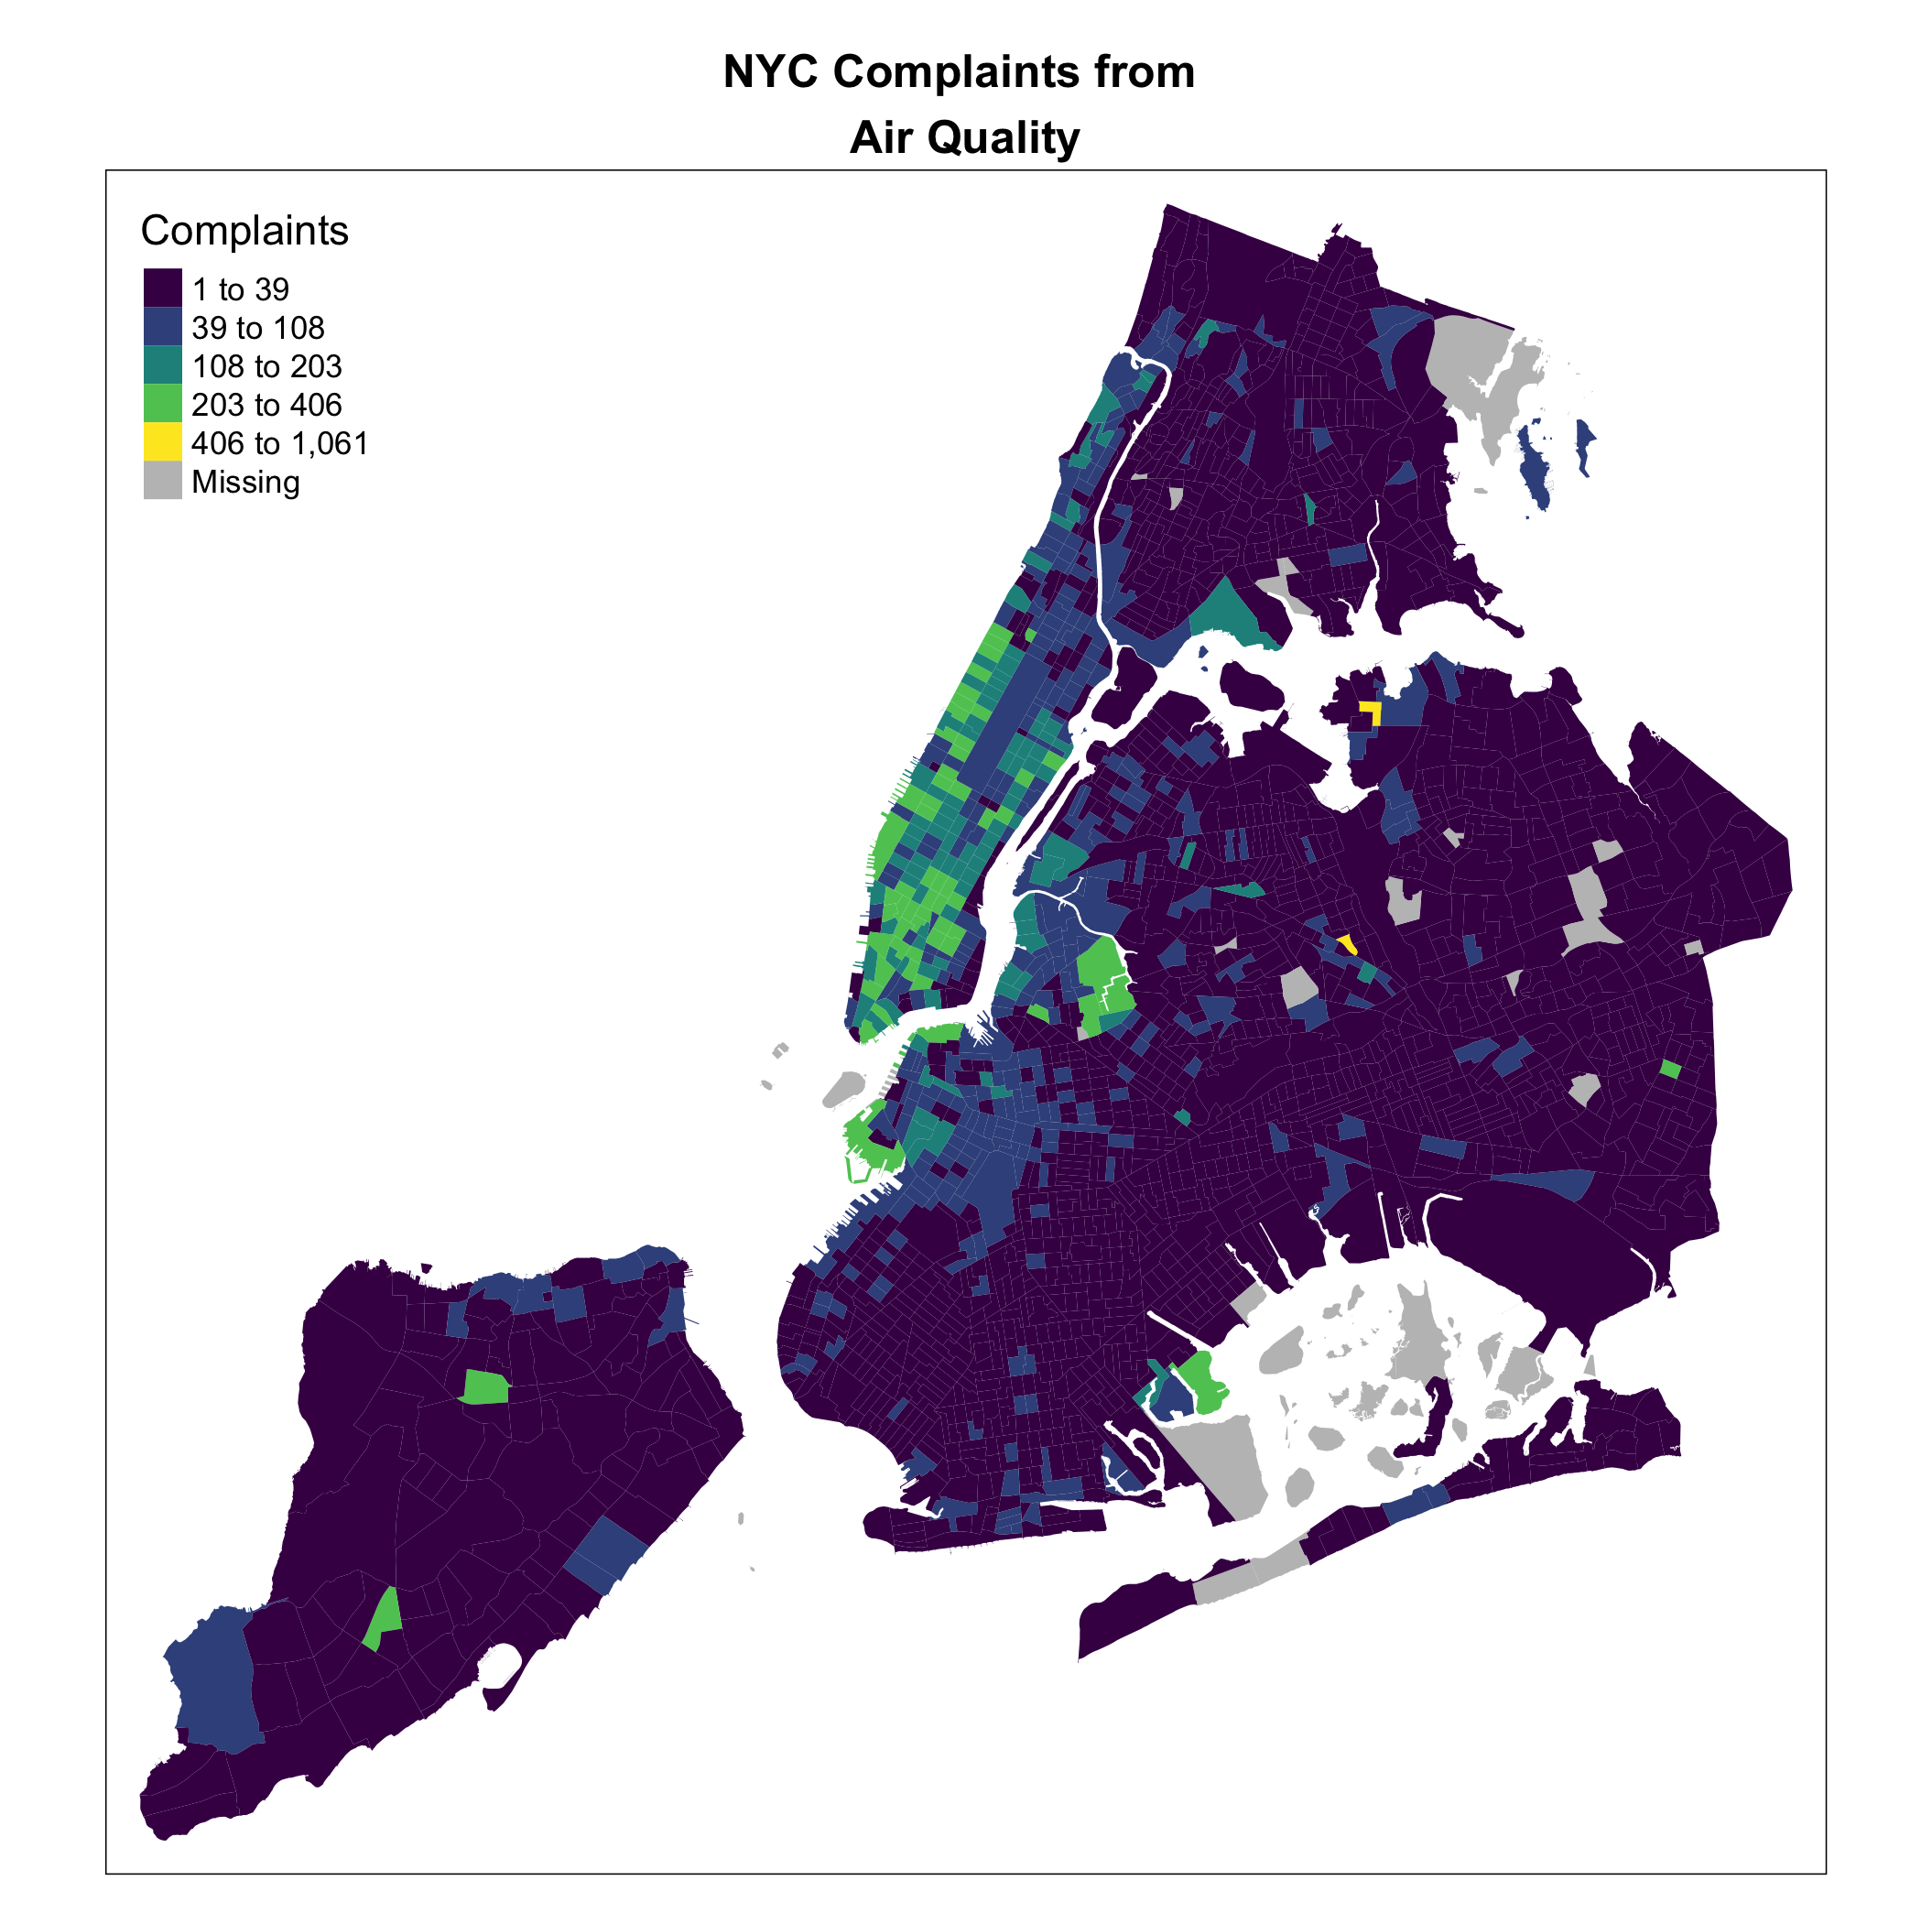
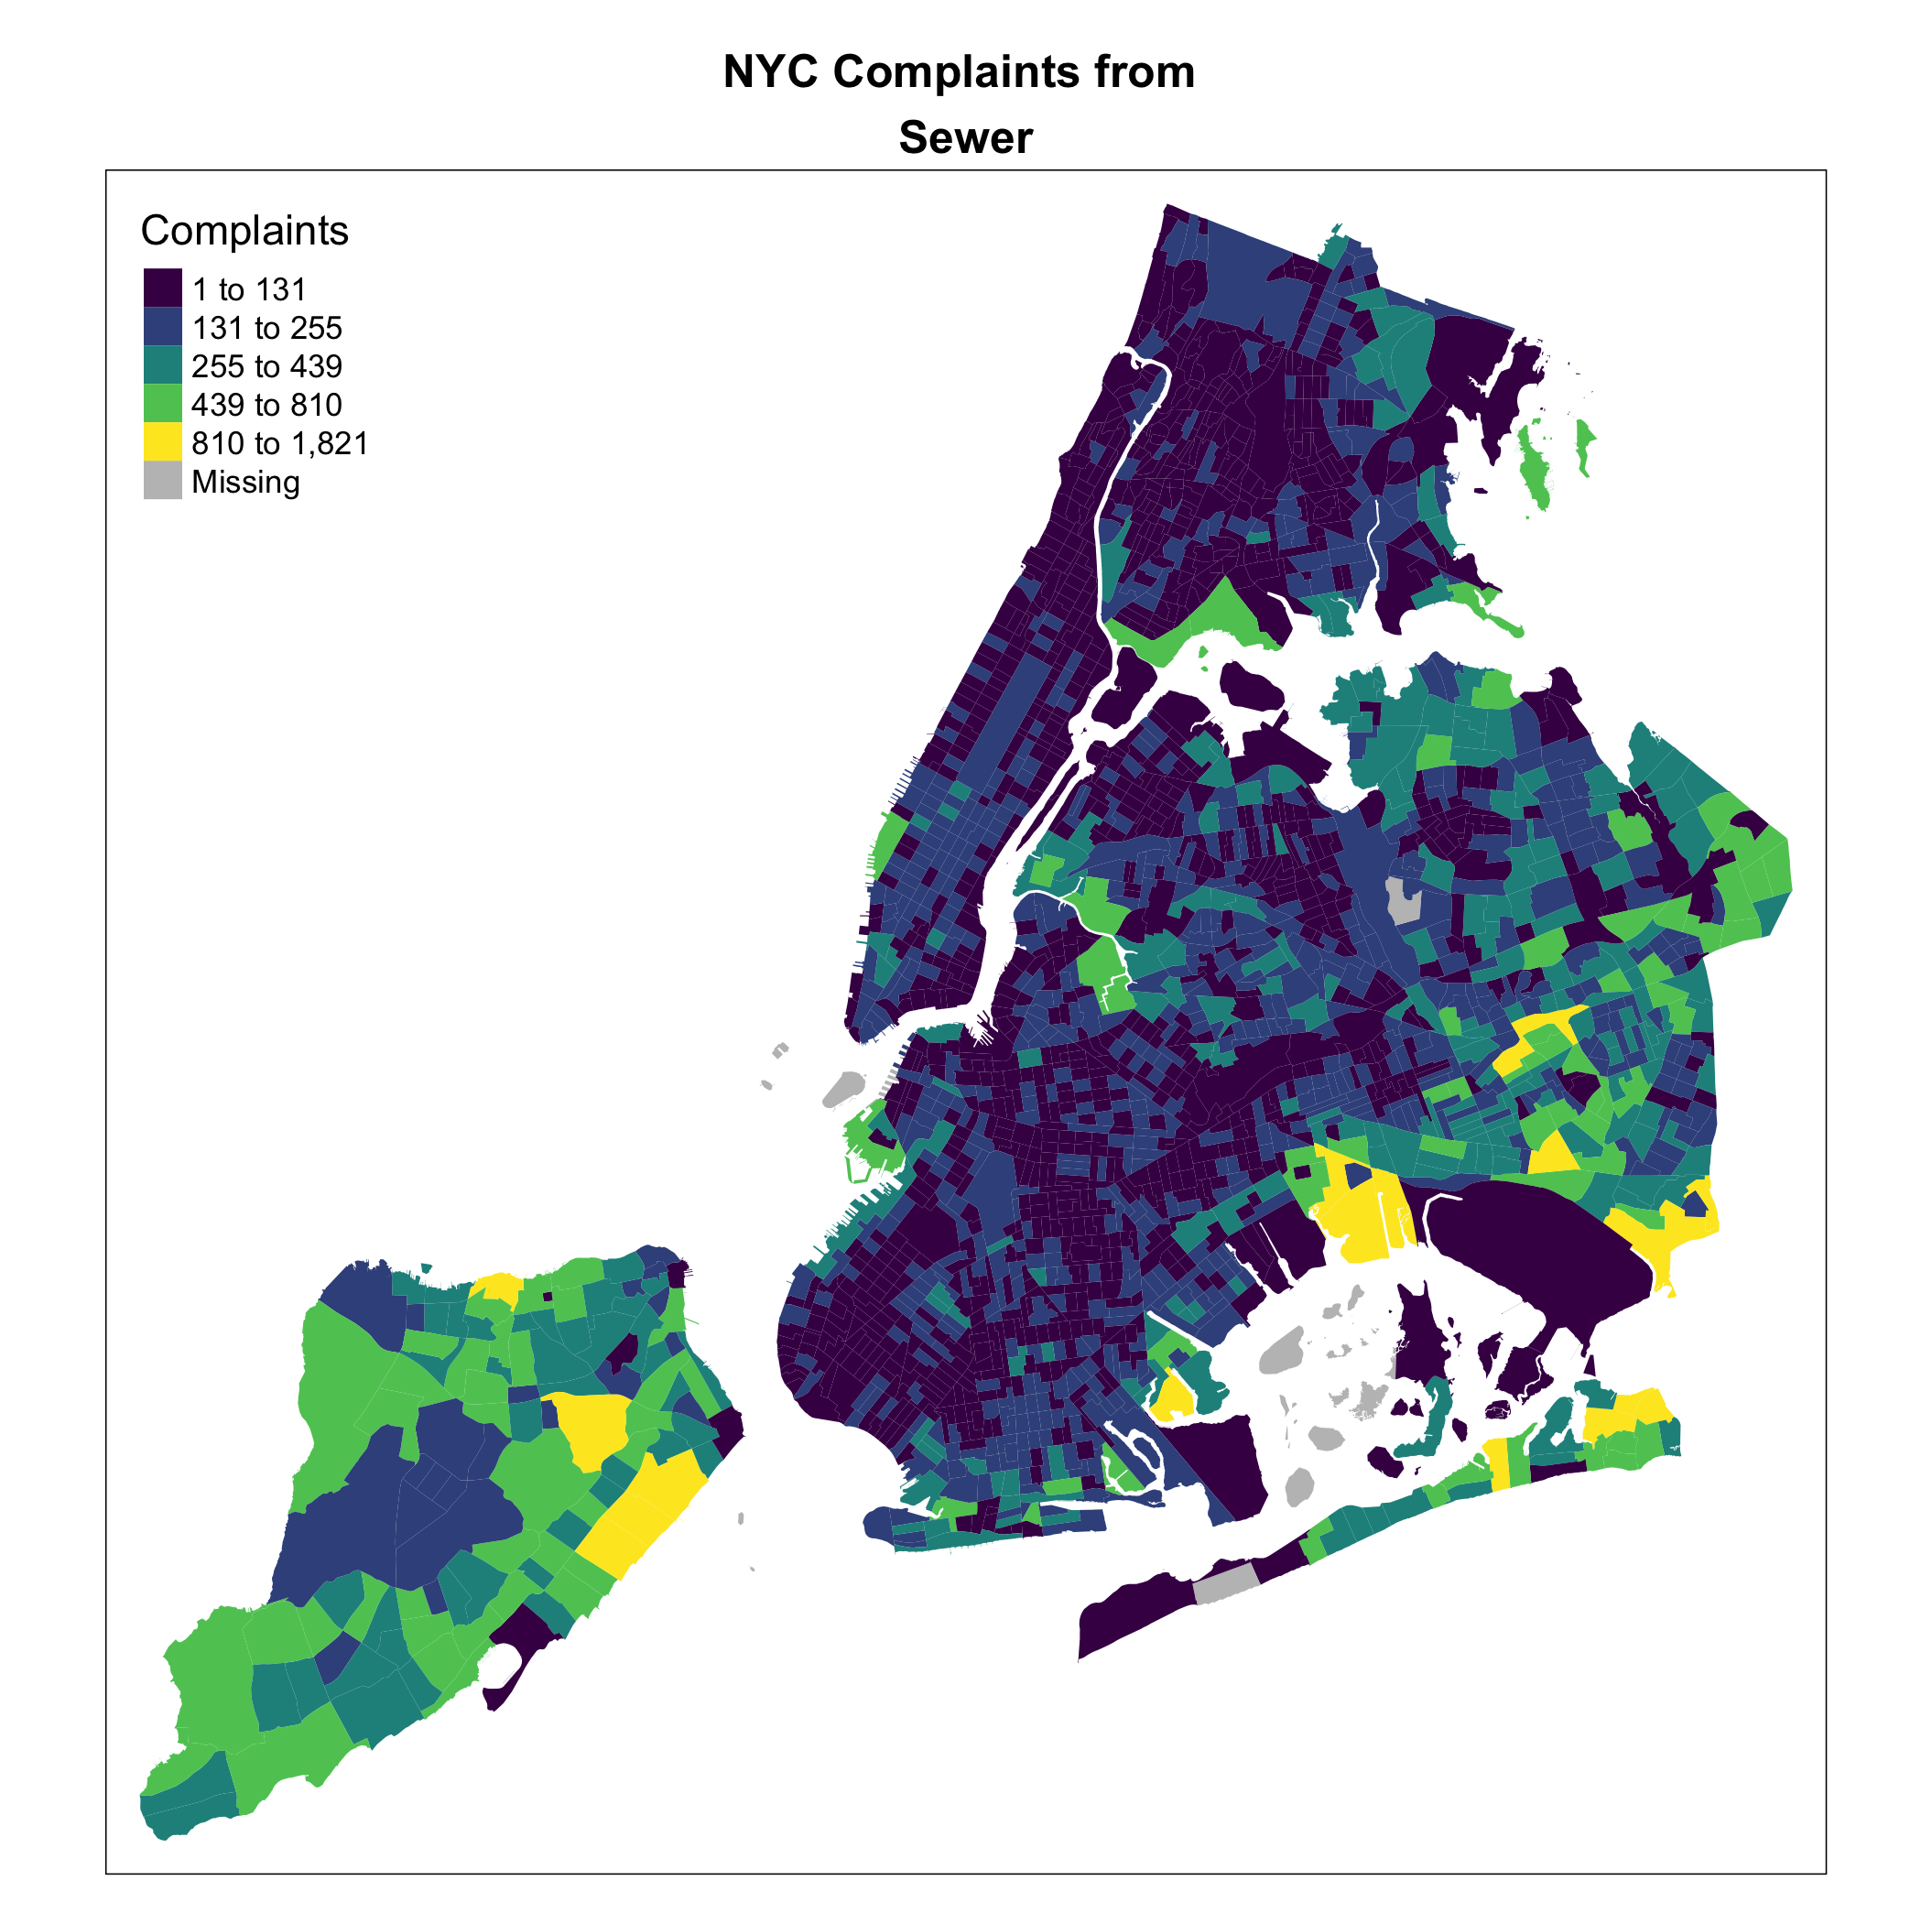
Geospatial Analysis:
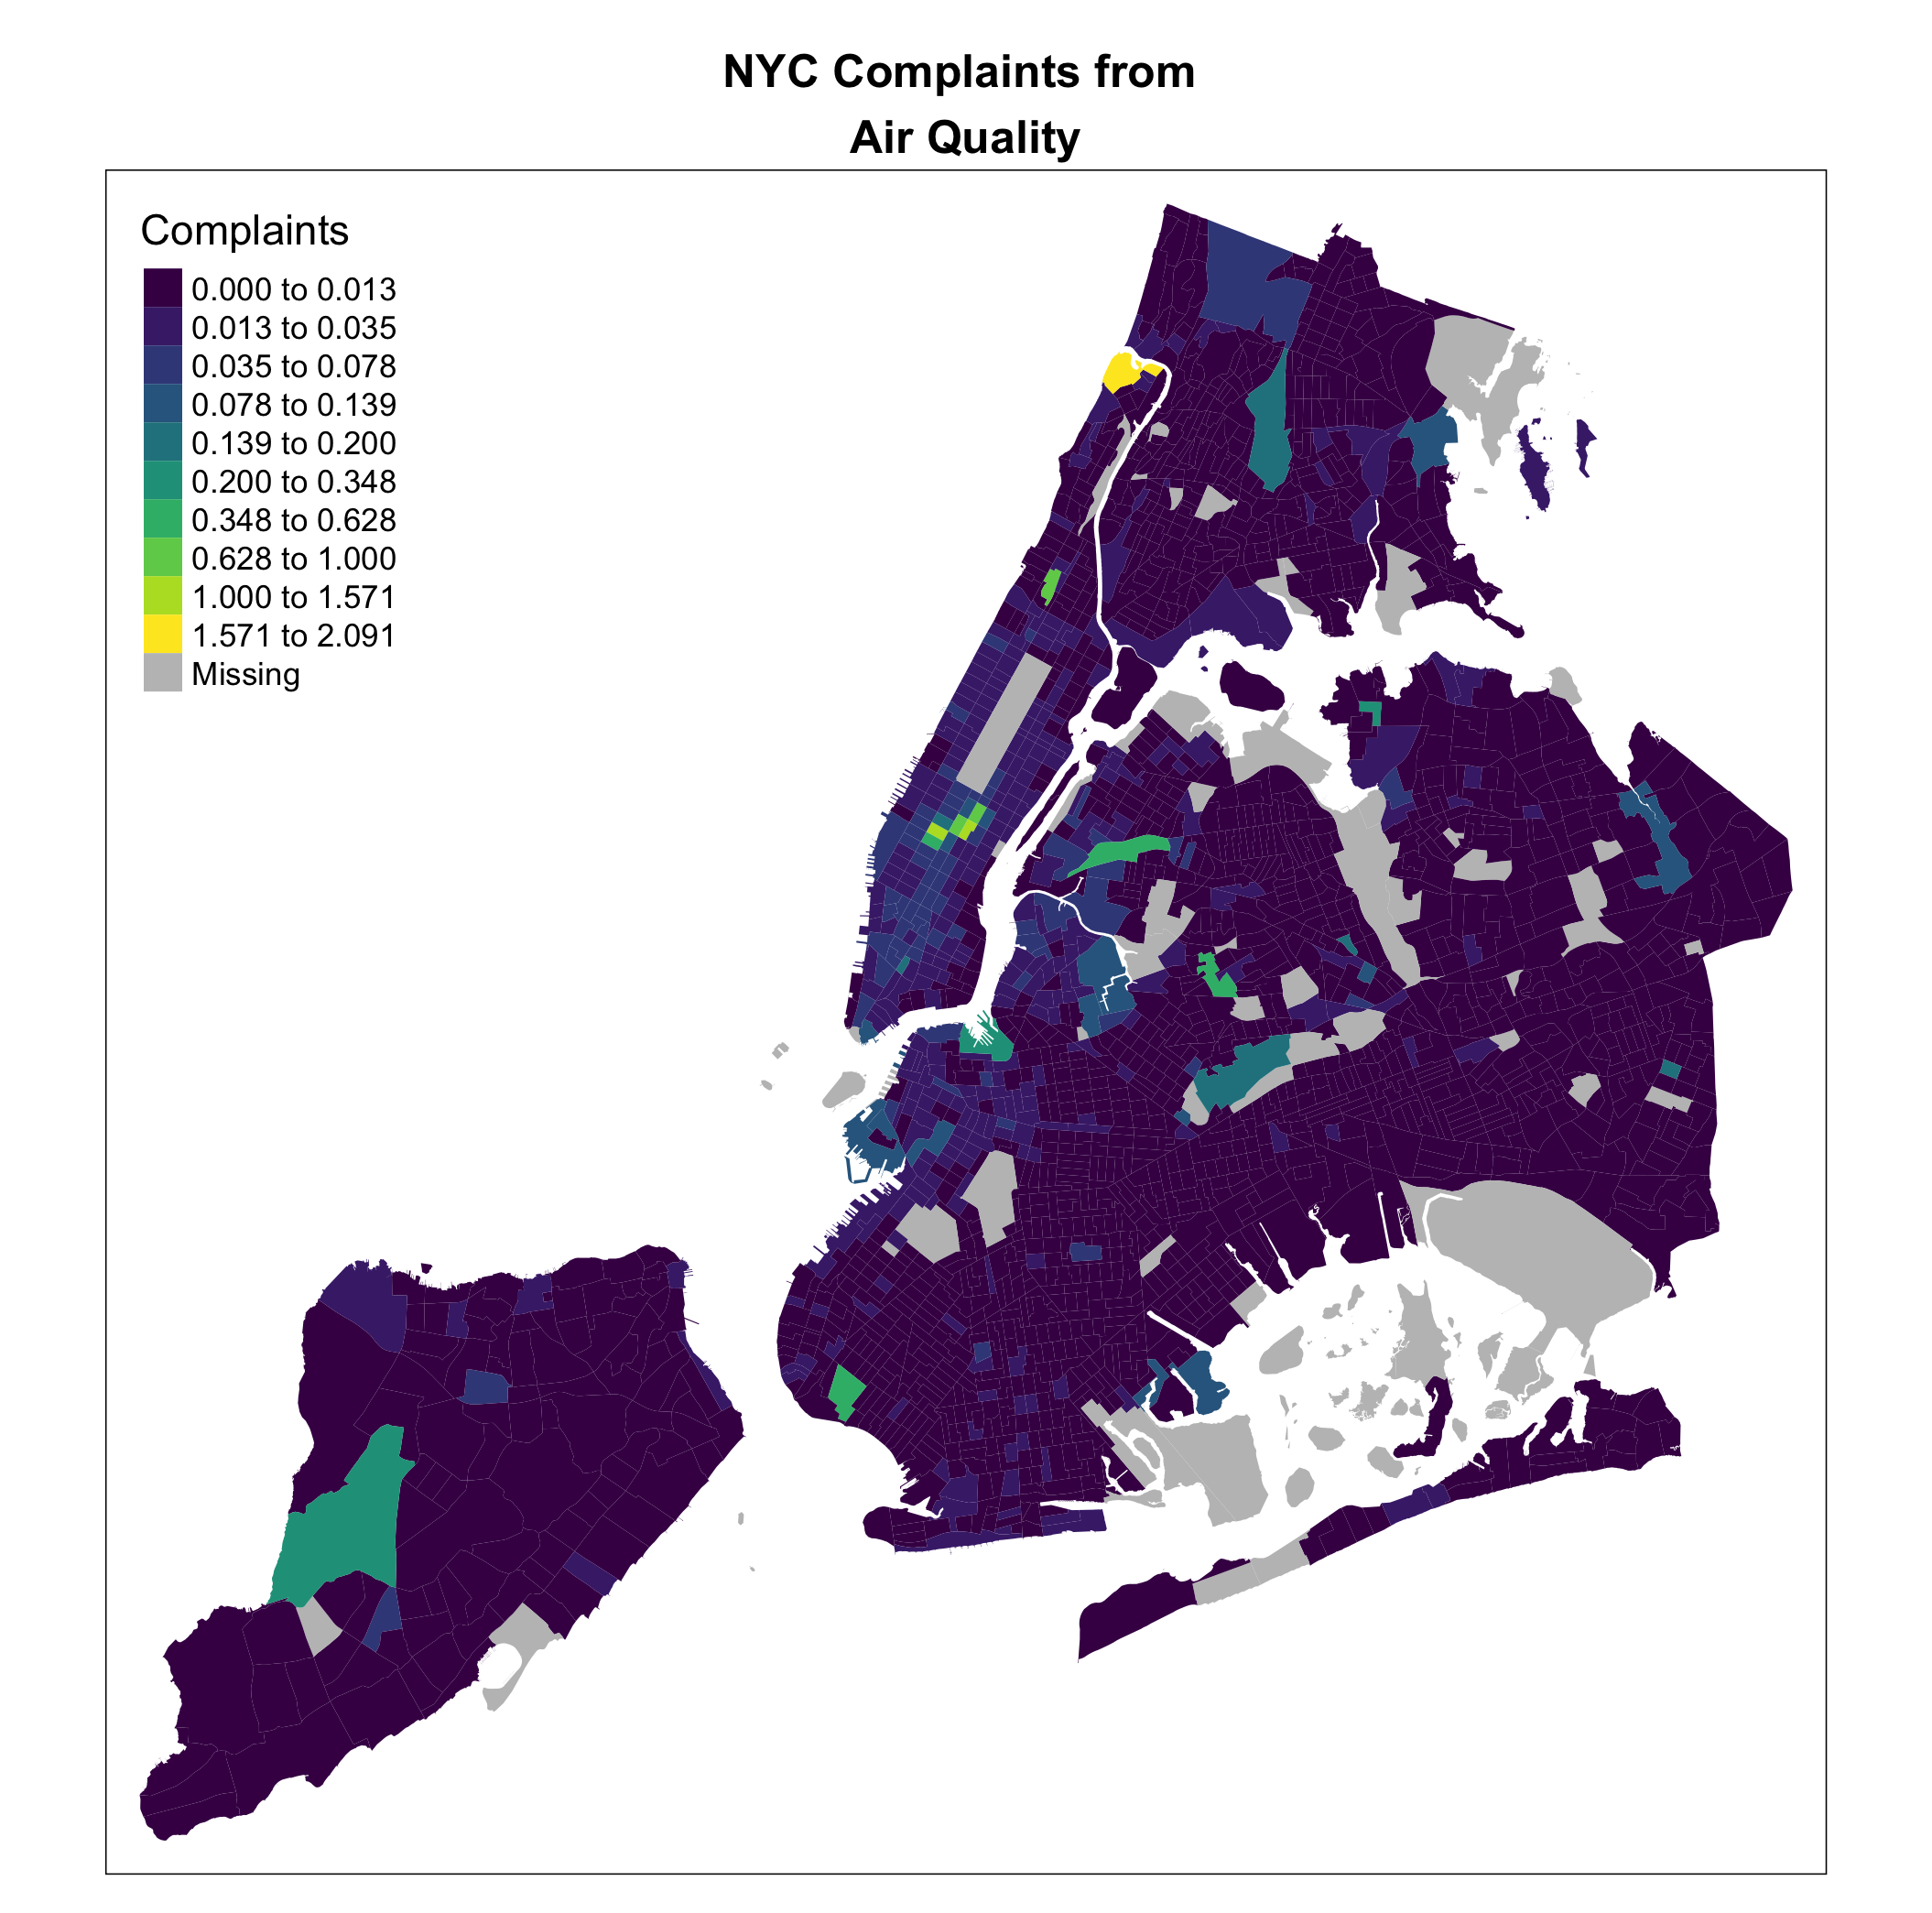
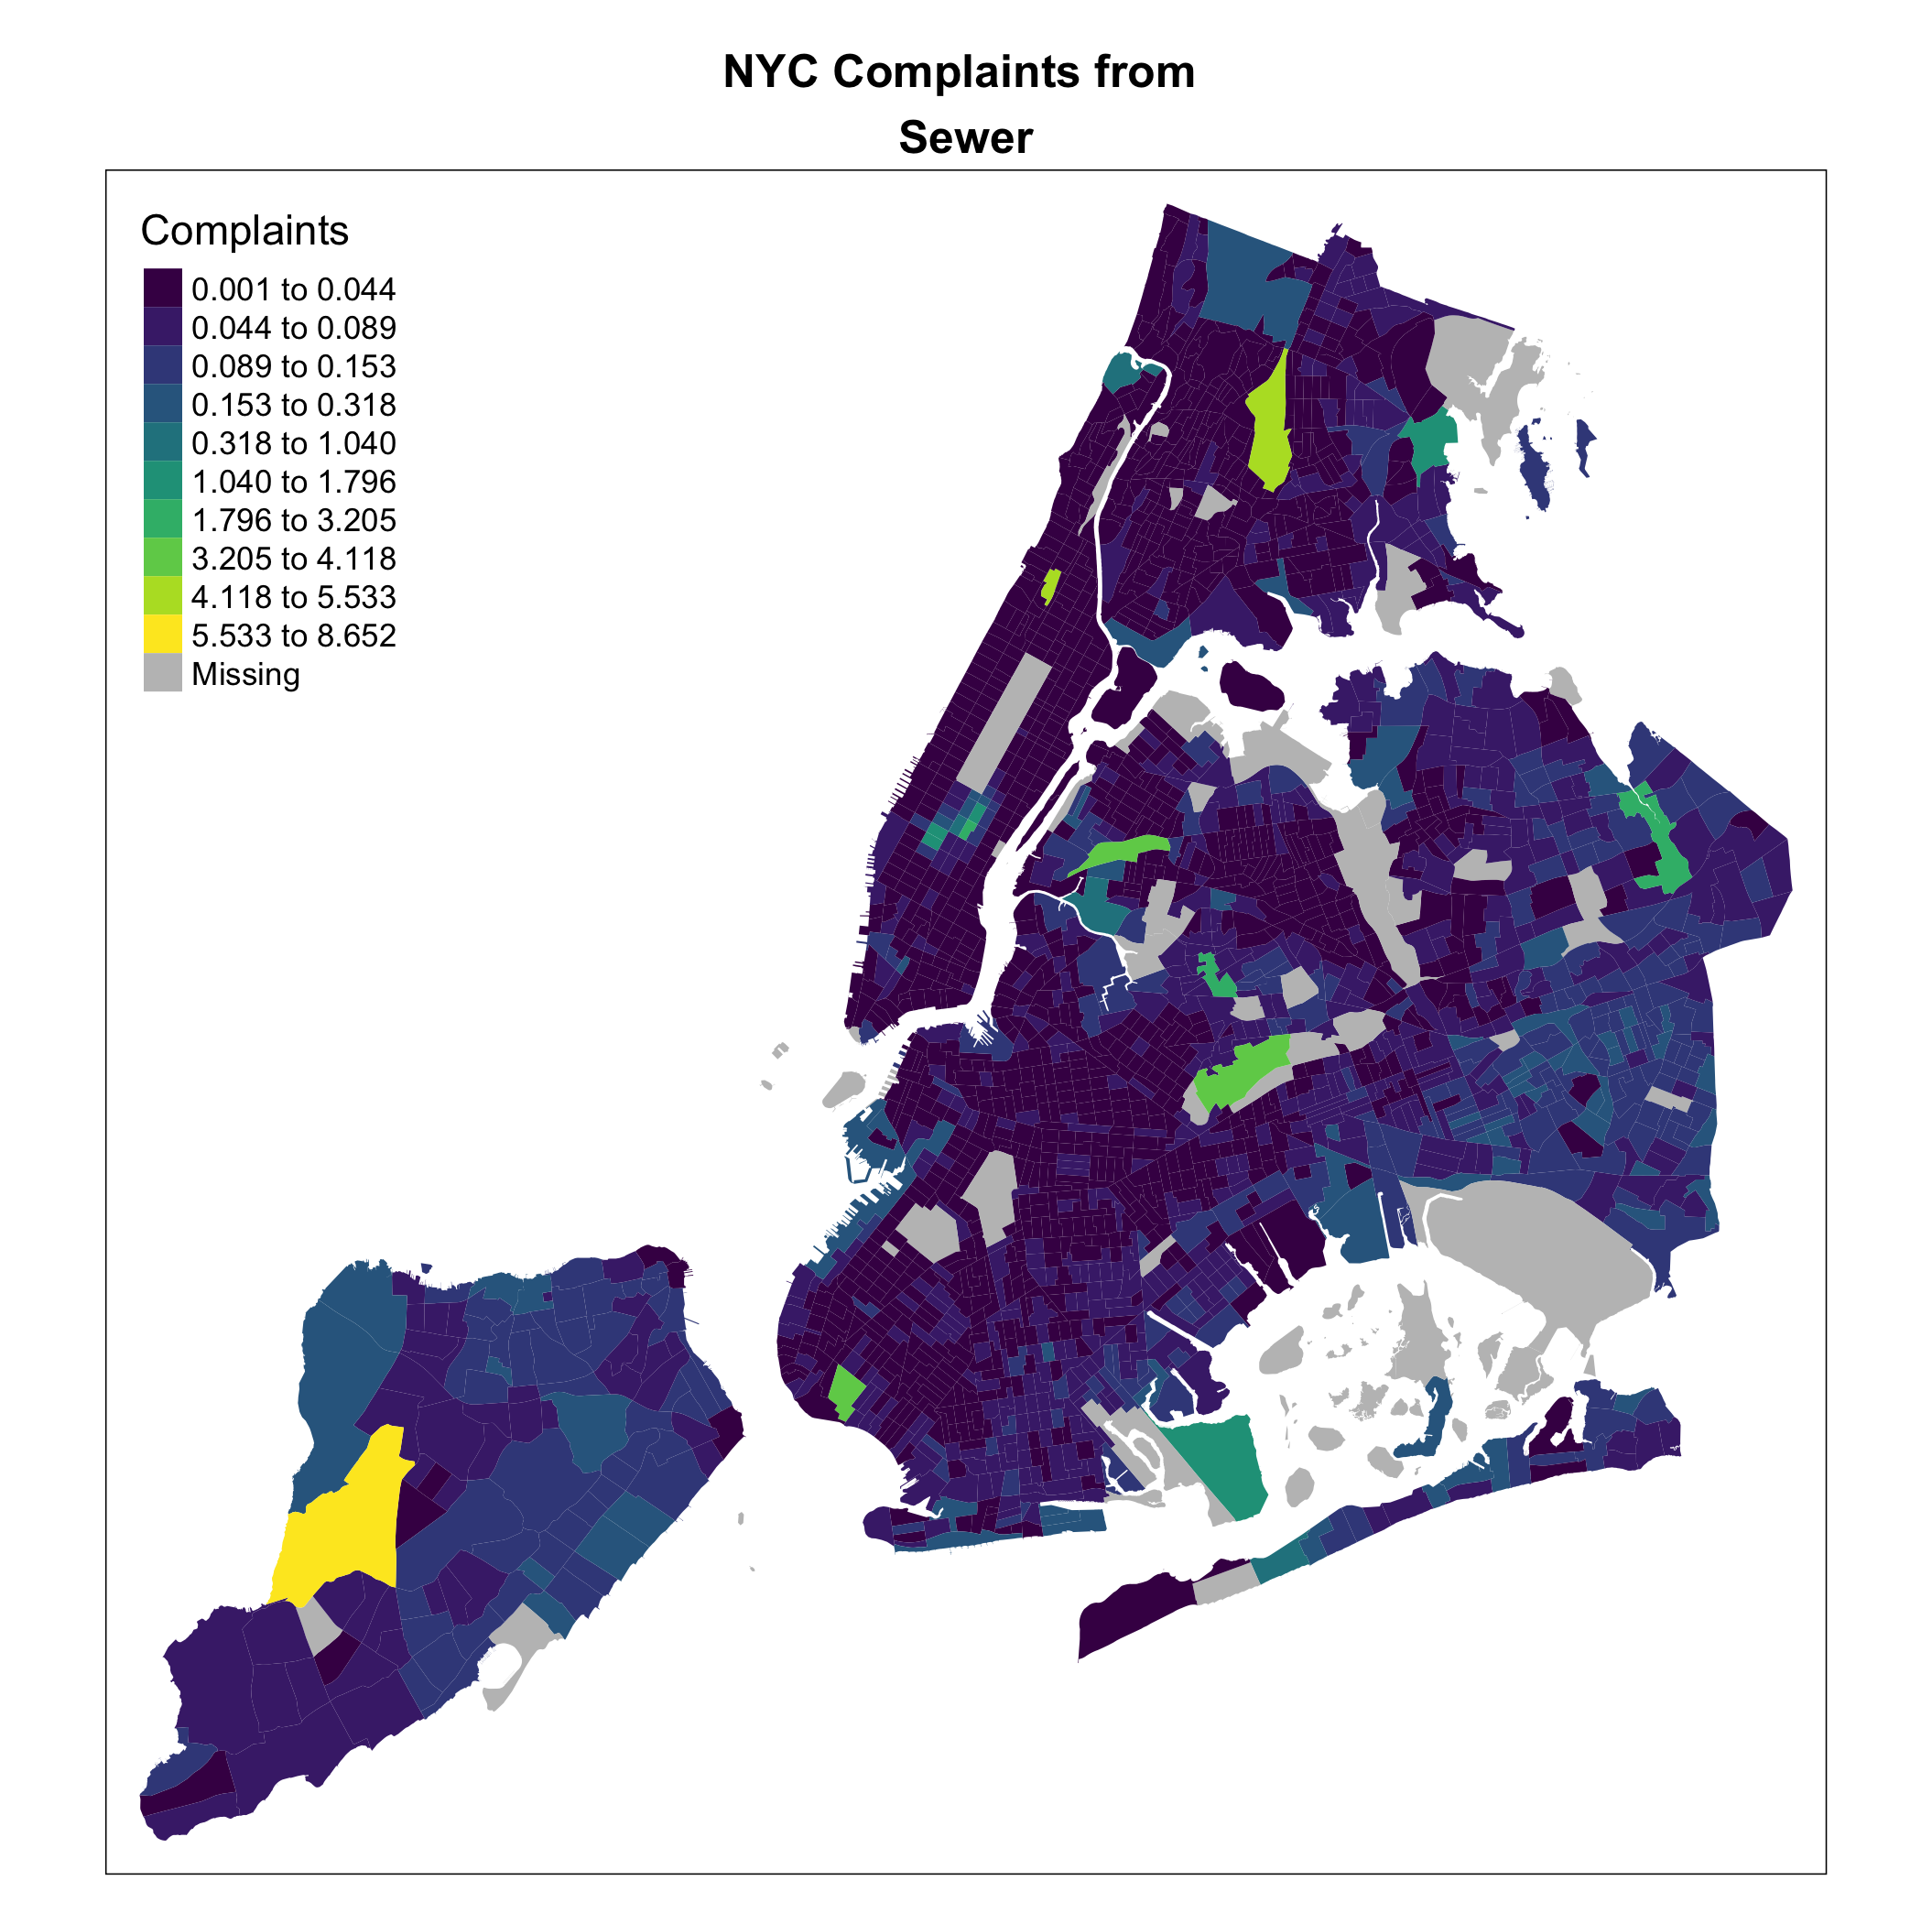
Another useful step was to determine where these complaints were distributed across the five boroughs, both in terms of the raw number of complaints and also normalized by population of the census tract.
Number of Complaints by Census Tract
Number of Complaints Per Capita by Census Tract
This research is ongoing, to be presented at the 2022 ACSP conference in Toronto. Stay tuned.
You can view the code for the exploratory data analysis, NGram Analysis, or extreme weather analysis if interested!
Project undertaken with guidance of professor Boyeong Hong .
Thumbnail Credit: NYC 311 Center