Vacant Storefronts
Inequitable Reporting of Vacant Storefronts
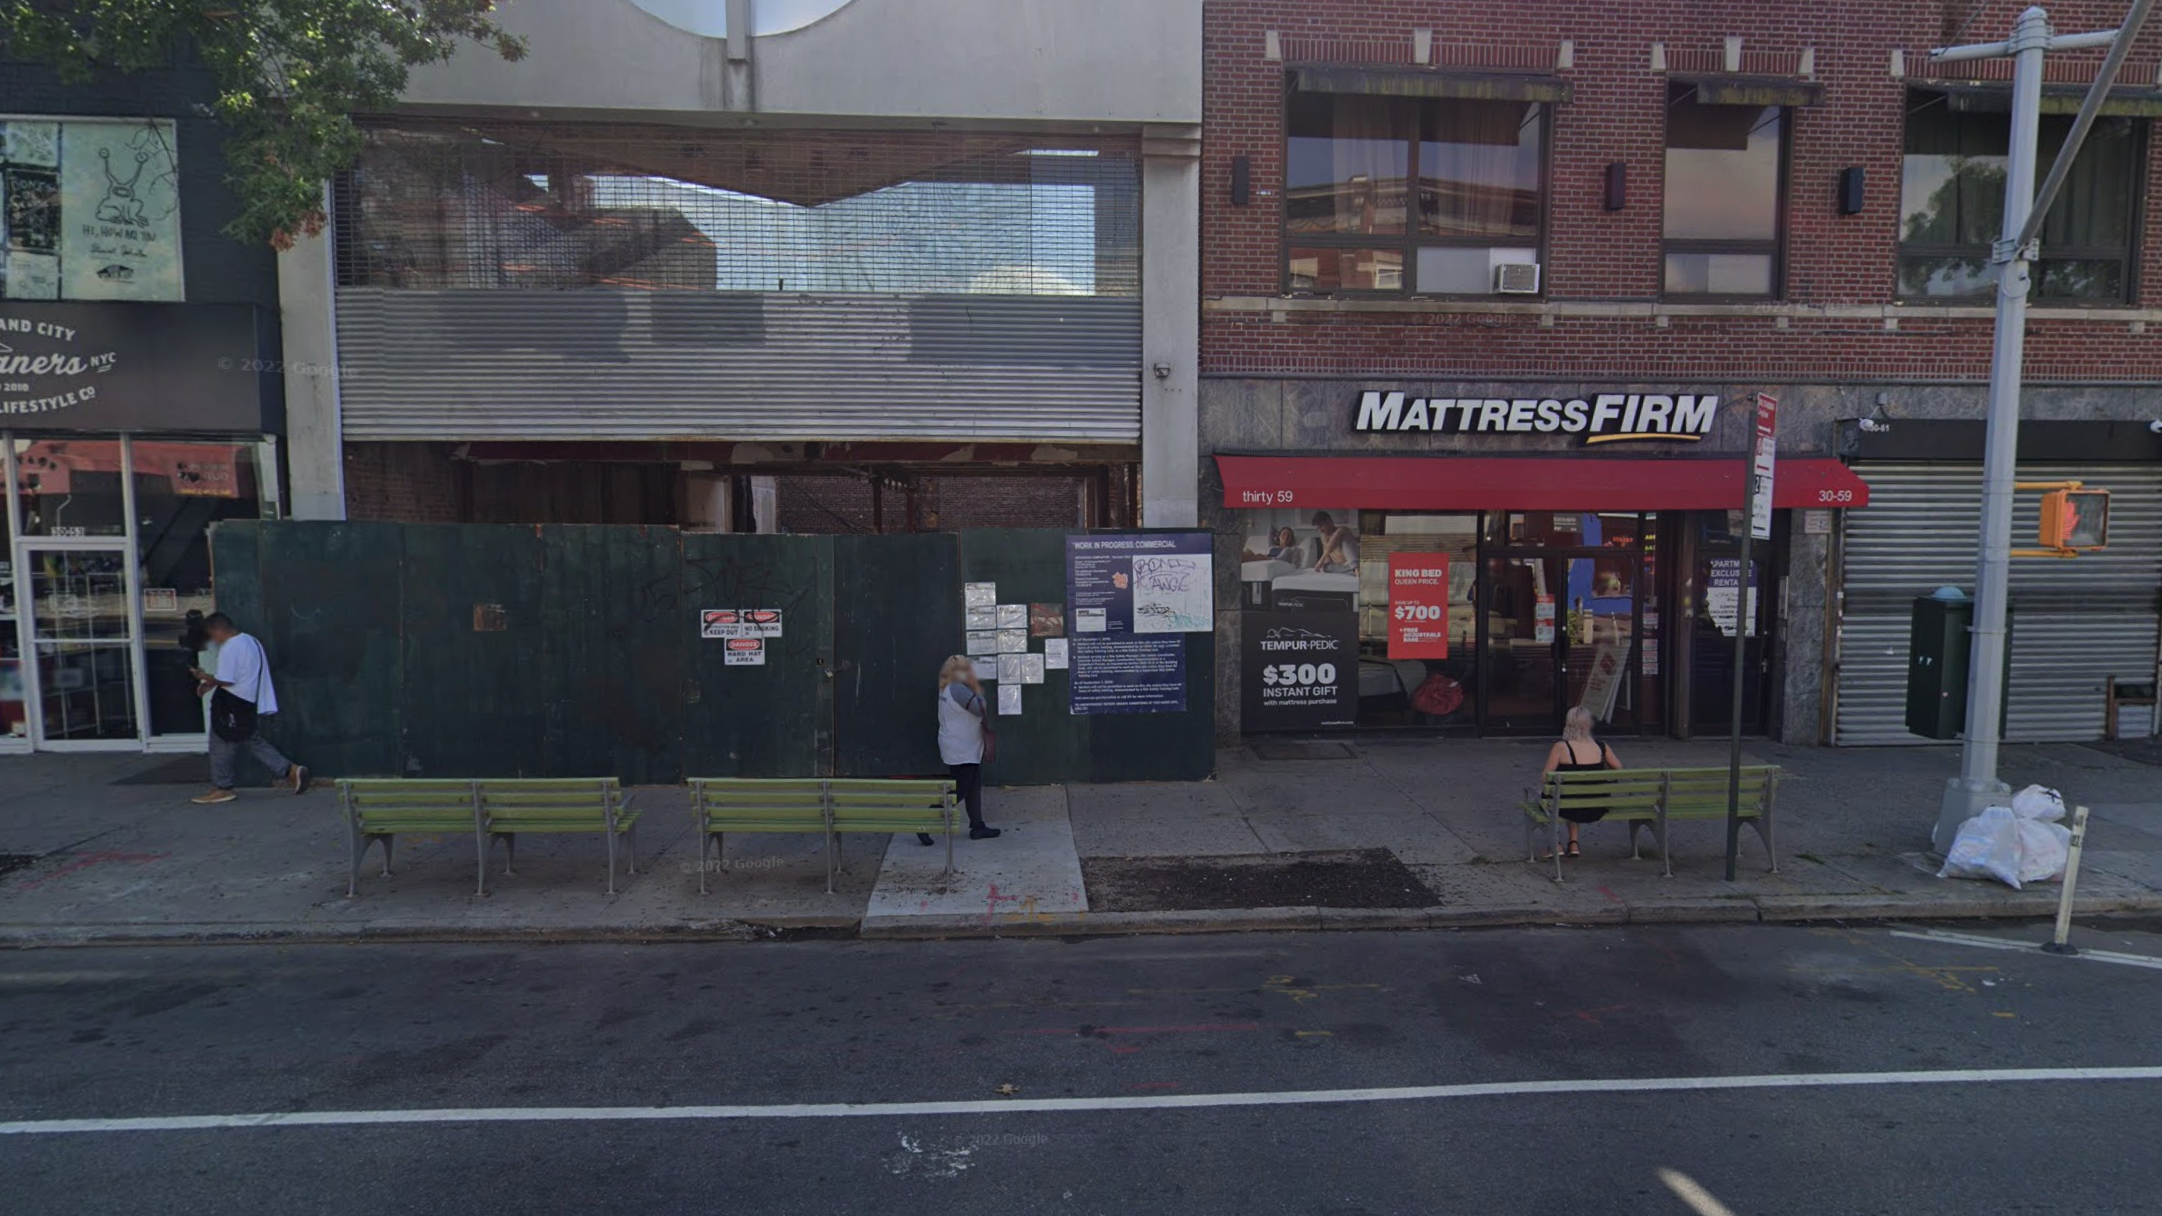
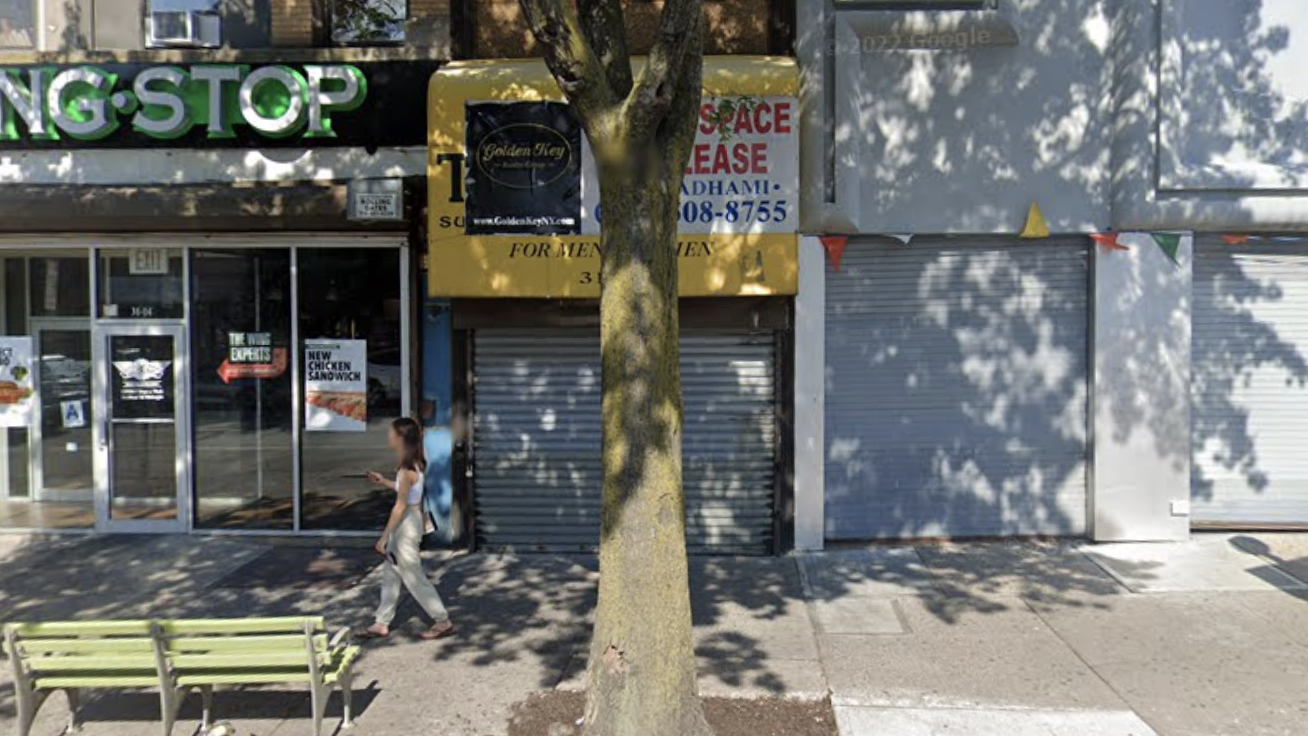
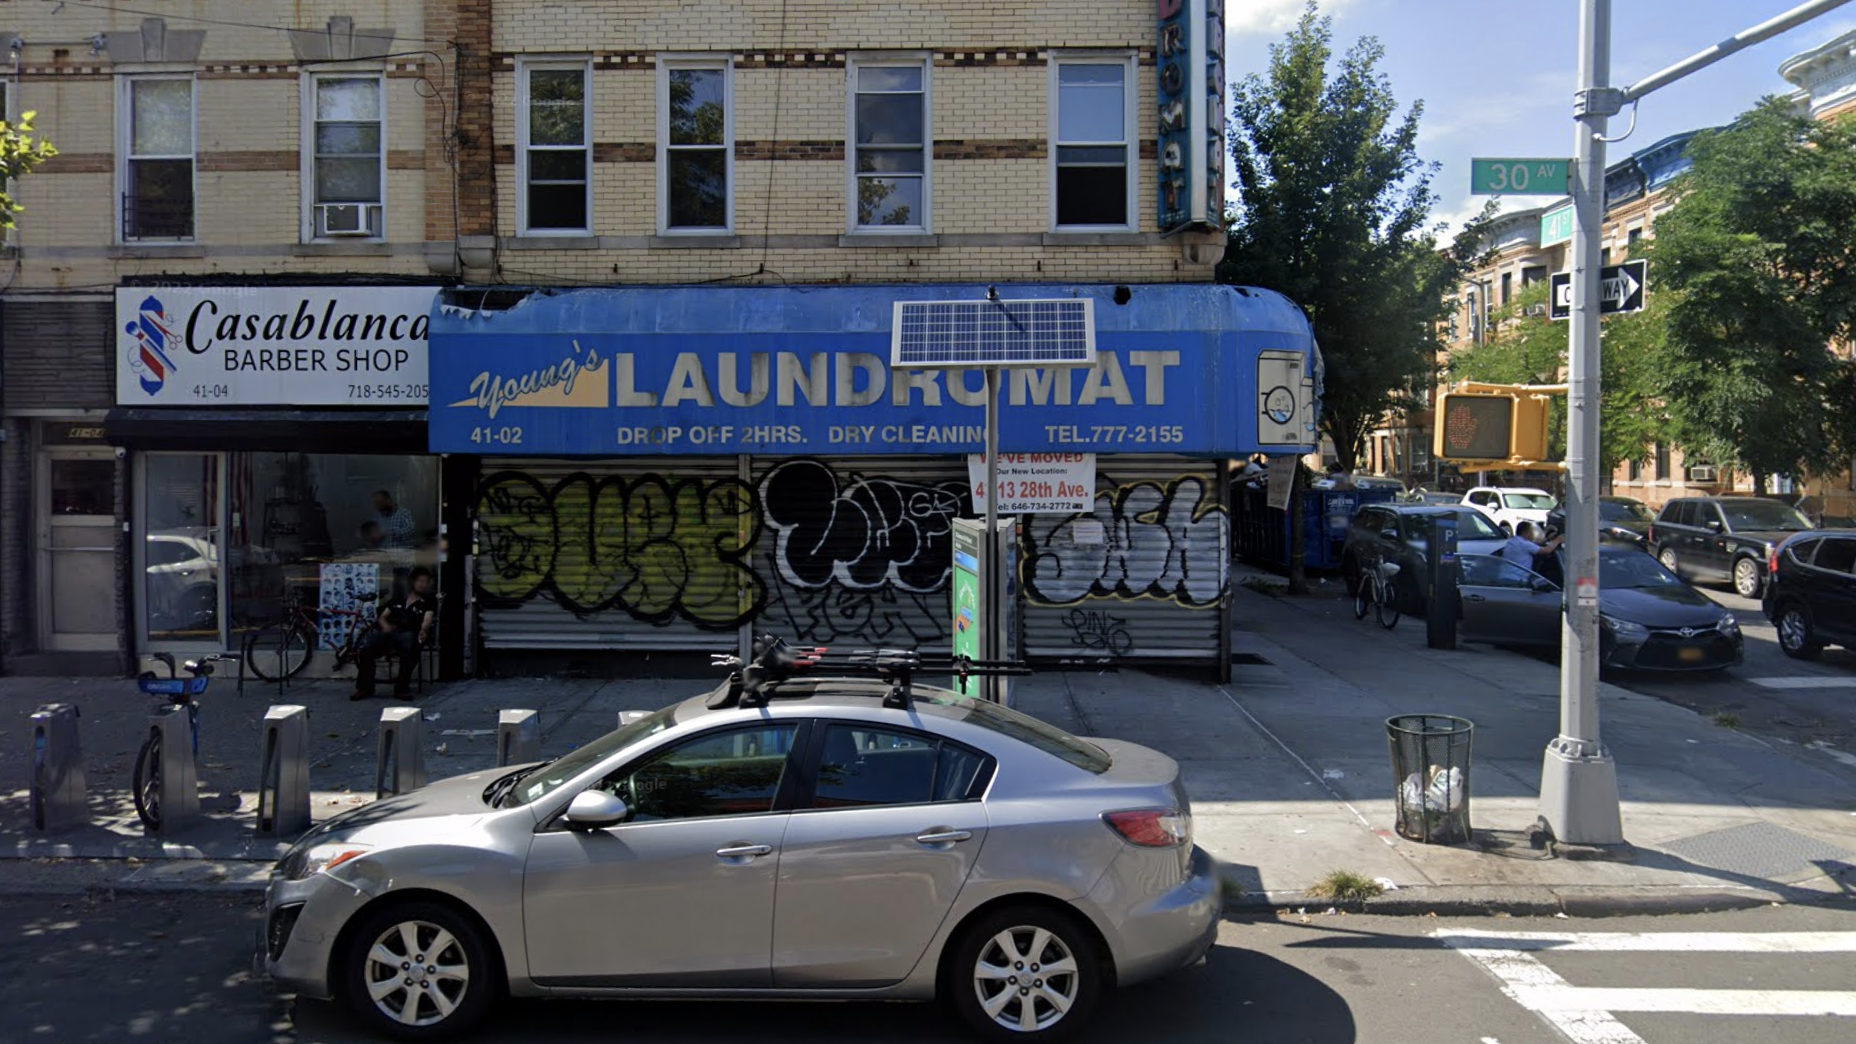
As COVID-19 battered New York City in 2019, neighborhoods experienced changes in storefront vacancies that varied greatly by geographic location. Once popular tourist destinations, neighborhoods like Hudson Yards and Midtown experienced a sharp decline in business activity that was well documented. Other neighborhoods, like Flushing and Astoria in Queens, experienced severe increases in vacancies while receiving less attention. Photographs taken from Google Street view show storefronts along a popular street in Astoria that had many vacancies.
Types of Storefronts
In response to Covid-19, the NYC Department of Finance began collecting datapoints on the 75,000 storefronts found across the city. The dataset, which covers just the following two years of the pandemic, captures the types of occupied storefronts, as well as the number of vacant storefronts, labeled as "No business activity identified." In both years, the vacancy rate remained around 13%.
Vacancy Rate vs. Land Price
We wanted to investigate whether storefronts in less wealthy neighborhoods experience more vacancies than their wealthier counterparts.
This scatterplot aims to explore the correlation between storefront vacancy rates and unit land
prices of the buildings in each NTA region. Since land value can be a good indicator of how wealthy a
neighborhood is, comparing vacancy rates with the median land price can suggest
whether this was the case.
The size of the circle indicates the number of the storefronts in each NTA. You can click through
each borough to see how each compares to the rest of New York. You can also hover over each circle
for details.
Vacancies Across New York City Neighborhoods
Open data from the City confirms that neighborhoods such as Astoria were hit particularly hard. However,
because only what is reported is displayed,
it’s important to understand how reported data matches lived experiences on the ground. The next step in
our investigation will be to conduct site visits
to Astoria, particularly on Steinway St, to see how reported data matches the lived experience on the
ground.
Feel free to explore the distribution of vacancies in 2020, 2021, and the change from one versus the
other. Zoom into the neighborhoods to
identify vacant storefronts, and click to obtain additional information reported by the City.


